MILESTONE 🌟 5 Million+ creative minds trust SlideEgg! Grab 80% OFF

Awesome PPT and Google Slides Charts Template

Line chart highlighting key points with percentages, showcasing the ultimate secret of PowerPoint charts.
P.ID : 15873
    229 views
    8 Downloads
    Get Custom Slides by Experts
    Instantly Access Templates in PowerPoint

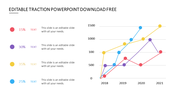
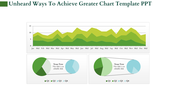
    PowerPoint Charts Template


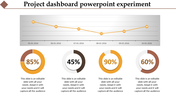
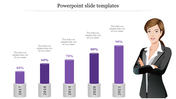
    Visualize your data and insights with clarity by showcasing trends with our PPT and Google Slides Charts Template. The slide comes with a curve that hikes and declines. Three percentage values are added to your context. Suitable for analyzing market trends, tracking financial performance and presenting project progress. 

    Ideal for business analysts, financial professionals, project managers and consultants. Download the template today to make informed decisions and drive results to propel your business forward with confidence.

    Features of the template

    • The slide contains 16:9 and 4:3 formats.
    • Compatible with Google slide themes and PowerPoint.
    • 100% customizable slides and easy to download.
    • It is easy to change the colors of the slide quickly.
    • Well-crafted template with an instant download facility.
    Advertisement

    You May Also Like These PowerPoint Templates

    Add to Wishlist
    Download
    AI Customize
    Colorful pie chart in PowerPoint slide showing 60, 30, and 10 percent segments with text boxes on a white backdrop.
    Add to Wishlist
    Download
    AI Customize
    Dashboard overview slide displaying traffic, payment, server load, expenses, and product metrics using graphs and charts.
    Free
    Add to Wishlist
    Download
    AI Customize
    Bar graph comparing financial data with blue and purple theme, with a text box explaining a high level approach.
    Add to Wishlist
    Download
    AI Customize
    PowerPoint template showing a line graph with three products A, B, and C plotted over time from 2015 to 2019.
    Add to Wishlist
    Download
    AI Customize
    Company annual report slide featuring financial data including net income, assets, deposits, and shareholders' equity.
    Add to Wishlist
    Download
    AI Customize
    Slide with a pie chart and a numbered list of five levels, each in orange, red, blue, green, and yellow.
    Add to Wishlist
    Download
    AI Customize
    Company annual report template featuring a line chart with two data series and space for points and descriptions with text.
    Add to Wishlist
    Download
    AI Customize
    Cycle chart slide featuring four percentage indicators in teal, green, blue, and red, with captions beow.
    Free
    Add to Wishlist
    Download
    AI Customize
    Timeline slide with horizontal bars in shades of green and blue, aligned to weekdays with placeholder text.
    Free
    Add to Wishlist
    Download
    AI Customize
    KWL chart PowerPoint template with sections for What I Know, What I Want to Know, and What I Learned with placeholder text.
    Add to Wishlist
    Download
    AI Customize
    Use Dashboard PPT Template Slide Designs
    Add to Wishlist
    Download
    AI Customize
    Slide with three donut shaped percentage charts showing 70%, 50%, and 90%, with corresponding captions beneath each.
    Add to Wishlist
    Download
    AI Customize
    Gantt chart in blue tones, showing task progress over weeks with horizontal bars and assigned team members.
    Add to Wishlist
    Download
    AI Customize
    KPI dashboard with bar graphs showing data trends over time and two green summary boxes.
    Add to Wishlist
    Download
    AI Customize
    Vehicle dashboard slide featuring a speedometer on the left and a detailed table on the right with its brands.
    Free
    Add to Wishlist
    Download
    AI Customize
    A PPT chart template featuring a table layout with rows labeled Text and columns with bar charts in different shades of blue.
    Add to Wishlist
    Download
    AI Customize
    Slide with multiple charts including bar, line, and pie charts illustrating data for hires, turnover, and training.
    Add to Wishlist
    Download
    AI Customize
    Bar chart slide design with stacked bars showing three categories per item and percentage captions on the left.