Comprehensive Chart PowerPoint Template and Google Slides

Line chart displaying annual revenue from 2014 to 2019 with a fluctuating trend, alongside bullet points for content.
P.ID : 32056
    213 views
    6 Downloads
    Get Custom Slides by Experts
    Instantly Access Templates in PowerPoint

    Comprehensive Chart PowerPoint Template and Google Slides


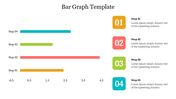
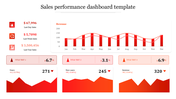
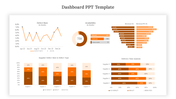
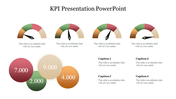
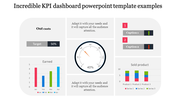
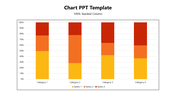
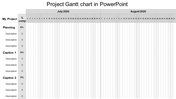
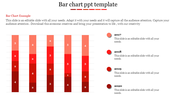
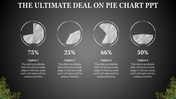
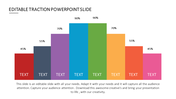
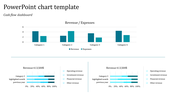
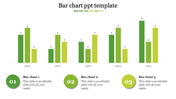
    Struggling to clearly communicate your company's annual revenue to stakeholders? Our Chart PowerPoint Template and Google Slides is designed to present your financial data with precision and clarity. This template features a detailed graph showcasing annual revenue in millions, making it easy for your audience to grasp your financial performance at a glance.

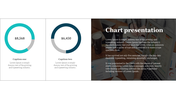
    Accompanied by bullet points, this template allows you to highlight and discuss key points, ensuring that stakeholders understand the critical aspects of your revenue trends and financial health. The clean, professional design enhances the credibility of your presentation.

    Deliver your financial data with confidence and clarity using this fully customizable template. Impress your stakeholders with a polished and effective presentation. Grab it now!

    Features of the template


    • 100% customizable slides and easy to download.
    • Slides are available in different nodes & colors.
    • The slide contains 16:9 and 4:3 formats.
    • It is easy to change the colors of the slide quickly. 
    • Well-crafted template with an instant download facility.
    Advertisement

    You May Also Like These PowerPoint Templates

    Add to Wishlist
    Download
    AI Customize
    Chart slide showing market supply data from 2004 to 2014 with red bars and percentage annotations.
    Add to Wishlist
    Download
    AI Customize
    Dashboard with four bar charts in yellow, green, teal, and red, comparing project risks and change requests.
    Add to Wishlist
    Download
    AI Customize
    Comparison slide featuring male and female icons, paired with captions and bar chart below, in blue and green tones.
    Add to Wishlist
    Download
    AI Customize
    Project Gantt chart with task descriptions, percentage completion, and horizontal progress bars.
    Add to Wishlist
    Download
    AI Customize
    Three circular dashboard dials with red, blue, and brown segments, each containing captions below.
    Add to Wishlist
    Download
    AI Customize
    Slide featuring a dashboard with three dials labeled Low, Mid, and High, indicating various levels of measurement.
    Add to Wishlist
    Download
    AI Customize
    Slide with pie charts, line graphs, and a bar chart in shades of green, illustrating data trends and comparisons.
    Free
    Add to Wishlist
    Download
    AI Customize
    PowerPoint slide showcasing projected cash flows, NPV for 3 and 5 years, and payback period with client testimonial.
    Add to Wishlist
    Download
    AI Customize
    Six month Gantt chart with bars in blue, green, red, orange, and teal, arranged for task tracking.
    Free
    Add to Wishlist
    Download
    AI Customize
    Infographic of a bar chart representing yearly growth from 2018 to 2021 with a businesswoman illustration.
    Add to Wishlist
    Download
    AI Customize
    Circular pie chart divided into five colored sections noted with percentages, with corresponding boxes for text area.
    Free
    Add to Wishlist
    Download
    AI Customize
    3D bar chart PowerPoint template showcasing data in four colored categories with a highlight and captions.
    Free
    Add to Wishlist
    Download
    AI Customize
    Horizontal chart with dual color bars in green and blue, displaying percentage values, and two captions on the right.
    Add to Wishlist
    Download
    AI Customize
    Slide with a vertical bar chart and four labeled sections, each paired with a unique color and icon.
    Free
    Add to Wishlist
    Download
    AI Customize
    Market research slide showing a line graph with three levels over the years 2016 and 2019, with a caption box.
    Free
    Add to Wishlist
    Download
    AI Customize
    A blue themed slide featuring a multi year bar chart comparison from 2016 to 2021 with three placeholders below.