MILESTONE 🌟 5 Million+ creative minds trust SlideEgg! Grab 80% OFF

Amazing Growth Strategy PPT Presentation Template Design

Five colorful triangular shapes in red, blue, orange, green, and teal, representing growth stages with values.
P.ID : 18087
    167 views
    3 Downloads
    Get Custom Slides by Experts
    Enhance Your Presentations with Add-ins
    Google Slides Add-in
    Access templates directly in Google Slides
    Microsoft PowerPoint Add-in
    Access templates directly in PowerPoint
    GPT Add-on
    AI-powered presentation assistance

    Drive Your Growth with Our Dynamic Growth Strategy PPT Template


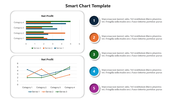
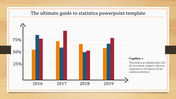
    Seeking to propel your business forward? Our "Growth Strategy PPT Template and Google Slides Themes" is the perfect tool for your next presentation. This template features a growth chart with five vibrant graphs in different colors and levels, each representing a stage of growth from 1 to 5, accompanied by short descriptions.

    Designed for entrepreneurs, executives, and consultants, this PowerPoint offers a clear roadmap for achieving business growth. Whether you're outlining market expansion plans, setting revenue targets, or presenting strategic initiatives, this template provides a visual framework for your growth strategy. Take charge of your growth journey today and unlock your business's full potential.


    Features of this template:

    • 100 % customizable slides are easy to download. 

    • Slides are available in different nodes and colors.

    • The slide was contained in 16:9 and 4:3 formats.

    • It is easy to change the slide colors quickly.

    • Well-crafted template with an instant download facility.

    • The clear layout of this template will help you design a professional-looking presentation.

    • The multi-color visuals on this slide will make your presentation eye-catching.

    Advertisement

    You May Also Like These PowerPoint Templates

    Add to Wishlist
    Download
    AI Customize
    Stacked Bar Chart PowerPoint Template Presentation
    Add to Wishlist
    Download
    AI Customize
    Editable Dot Charts PowerPoint Template For Presentation
    Add to Wishlist
    Download
    AI Customize
    Slide showcasing survey data with percentage figures in colored text boxes and icons with a comparative bar chart.
    Add to Wishlist
    Download
    AI Customize
    Hexagonal web chart with blue and red lines showing financial data for six business areas at the corners.
    Add to Wishlist
    Download
    AI Customize
    Change curve diagram mapping emotional responses over time, with stages from shock and denial along a wavy line.
    Add to Wishlist
    Download
    AI Customize
    Innovative Cockpit Charts PowerPoint Download PPT Slides
    Add to Wishlist
    Download
    AI Customize
    A line chart  slide showing data trends across seven items with two percentage indicators with icons and caption areas.
    Add to Wishlist
    Download
    AI Customize
    Bar chart slide showing data trends from 2016 to 2021 with three categories, highlighted in red, teal, and yellow bars.
    Add to Wishlist
    Download
    AI Customize
    Circular progress bar with four colorful concentric rings and percentage labels, surrounded by text areas.
    Free
    Add to Wishlist
    Download
    AI Customize
    Color-coded Gantt chart template for project management, displaying four phases across quarters with colorful text boxes.
    Add to Wishlist
    Download
    AI Customize
    Three outlined boxes in yellow, red, and green, each with circles labeled K, W, and L, at the bottom.
    Add to Wishlist
    Download
    AI Customize
    A dynamic slide layout featuring a circular pie chart, with labeled segments and placeholder text.
    Add to Wishlist
    Download
    AI Customize
    Two line graphs comparing data trends with different colors, featuring seven data points on each chart.
    Add to Wishlist
    Download
    AI Customize
    Colorful circle chart depicting percentage distribution across four categories, with accompanying captions for each segment.
    Add to Wishlist
    Download
    AI Customize
    Stacked column chart with three categories, percentage labels, and circular step icons on both sides with percentage figures.
    Add to Wishlist
    Download
    AI Customize
    A stock chart with five vertical bars in orange and teal, representing financial data for a day period.