Easy To Customize Gantt Chart PowerPoint And Google Slides

Gantt chart layout with blue boxes, lines, and a red arrow in a white background indicating progress timeline.
P.ID : 3310
    719 views
    27 Downloads
    Get Custom Slides by Experts
    Instantly Access Templates in PowerPoint

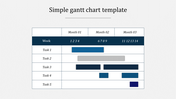
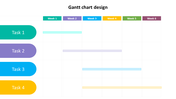
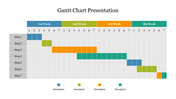
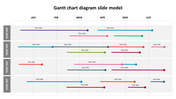
    Gantt Chart Presentation Slides


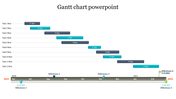
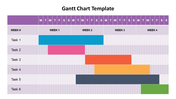
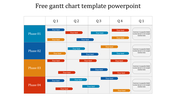
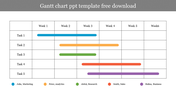
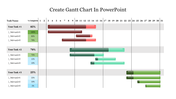
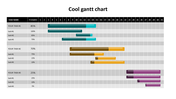
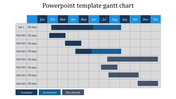
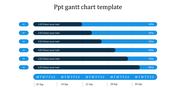
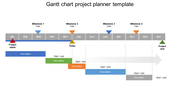
    In the realm of project management, a Gantt Chart is a powerful visual tool simplifying complex projects into a clear and organized timeline. This user-friendly concept streamlines project planning by breaking tasks into manageable components, allocating resources effectively, and establishing realistic timelines. It provides a visual representation where horizontal bars denote the duration of each task, allowing for efficient planning, tracking, and management. Stakeholders gain a comprehensive view of project progress, dependencies, and critical milestones, making it an indispensable instrument for project managers, team leaders, and students alike. This PowerPoint template is specifically designed to cater to project managers, business professionals, students, and anyone involved in project planning and management. With fully editable slides, it offers a wide range of professionally designed layouts, timeframes, and task allocation features that simplify the creation of Gantt Charts and enhance project planning efficiency. Whether you're overseeing complex projects, organizing team activities, or managing academic assignments, this template helps you communicate and track project timelines effectively, saving you time and effort. By utilizing this template, you'll streamline project planning, improve communication, and save valuable time, ultimately helping you achieve your project goals efficiently. We encourage you to leverage this user-friendly template to enhance your project management skills and make your projects a resounding success.


    Features of the template:


    • 100% customizable slides and easy to download.
    • Slides are available in different nodes & colors.
    • The slide contains 16:9 and 4:3 formats.
    • Easy to change the colors of the slide quickly.
    • Highly compatible with PowerPoint and Google Slides.
    • Well-crafted template with an instant download facility.
    Advertisement

    You May Also Like These PowerPoint Templates

    Free
    Add to Wishlist
    Download
    AI Customize
    Gantt chart with colored bars representing tasks for nine items over two weeks, displayed across a grid layout.
    Add to Wishlist
    Download
    AI Customize
    Gantt chart slide deck with colorful bars showing project schedules, tasks, and deadlines over weekly and monthly timelines.
    Add to Wishlist
    Download
    AI Customize
    Gantt chart slide displaying task schedules across a month with color coded task progress.
    Add to Wishlist
    Download
    AI Customize
    A horizontal Gantt chart showing project timeline with colored bars for tasks and milestones labeled across the months.
    Add to Wishlist
    Download
    AI Customize
    Gantt chart with colored bars displaying tasks across months, showing project progress on a dark background.
    Free
    Add to Wishlist
    Download
    AI Customize
    Simple Gantt chart slide displaying task schedules across three months with each task's duration represented by colored bars.
    Add to Wishlist
    Download
    AI Customize
    Gantt chart slide with horizontal gray task bars and percentage completion for months in a color coded header.
    Add to Wishlist
    Download
    AI Customize
    Gantt chart displaying task progress for seven steps, each represented by colored bars spanning from January to June.
    Add to Wishlist
    Download
    AI Customize
    Gantt chart template showing tasks with percentage completion values, organized along a thirty one days colored timeline.
    Add to Wishlist
    Download
    AI Customize
    Slide with a chart layout showing timeline across four weeks, with tasks in blue, green, yellow, and orange bars.
    Add to Wishlist
    Download
    AI Customize
    Horizontal gantt chart displaying six projects with colored bars showing timelines across months.
    Add to Wishlist
    Download
    AI Customize
    Gantt chart displaying tasks with varying progress percentages over a 31-day timeline using colored bars.
    Add to Wishlist
    Download
    AI Customize
    Project timeline Gantt chart divided into two halves, showcasing task completion levels with gray progress bars.
    Add to Wishlist
    Download
    AI Customize
    Attractive Gantt Chart Sample PowerPoint Presentation
    Add to Wishlist
    Download
    AI Customize
    Gantt chart with seven tasks and their corresponding timeframes, shown in color-coded bars for each day in March 2021.
    Add to Wishlist
    Download
    AI Customize
    Editable Gantt Chart PowerPoint Presentation Template