Dashboard Presentation Template and Google Slide Themes

Blurred car dashboard with speedometer, overlaid with a blue text box placed in dark background.
P.ID : 31524
    175 views
    1 Downloads
    Get Custom Slides by Experts
    Instantly Access Templates in PowerPoint

    Dashboard Presentation Template: Elevate Your Data Insights


    Dashboard your data with our Dashboard Presentation Template, designed to make a powerful first impression.

    Understanding the template

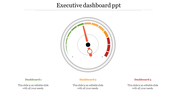
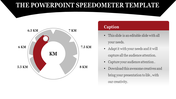
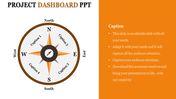
    This template features a bold car dashboard image as the centerpiece, creating a professional and sleek look for your title slide. It sets the stage for your presentation by conveying clarity, control, and precision from the very beginning.

    Purpose of the Slide

    The primary purpose of this title slide is to introduce your presentation topic with impact and authority. It establishes the theme of data visualization and sets expectations for a structured, insightful presentation. This slide is perfect for kicking off meetings, business reviews, project updates, and performance reports.

    Who can use this slide

    This Dashboard Template is ideal for business professionals, analysts, project managers, and students. 

    Don't wait. Get it today!

    Features of the template:


    • 100% customizable slides and easy to download.
    • The slides contain 16:9 and 4:3 formats.
    • Easy to change the colors quickly.
    • It is a well-crafted template with an instant download facility.
    • It is a 100% pre-designed slide.
    Advertisement

    You May Also Like These PowerPoint Templates

    Add to Wishlist
    Download
    AI Customize
    Effective Dashboard PowerPoint Templates Design
    Add to Wishlist
    Download
    AI Customize
    Dashboard slide featuring a stacked bar chart in red, green, and purple, and two speedometer gauge indicators below.
    Add to Wishlist
    Download
    AI Customize
    Dashboard slide with a circular chart in blue shades, featuring percentage labels, and five icons with text on the right.
    Add to Wishlist
    Download
    AI Customize
    Dashboard slide with a pie chart, stacked area chart, and multiple colored rectangular boxes displaying metrics.
    Add to Wishlist
    Download
    AI Customize
    KPI dashboard slide with metrics for Visits, Visitors, Conversion rate, and Revenue per user along with views per device.
    Add to Wishlist
    Download
    AI Customize
    Best Dashboard Sales Performance Reports Revenue Charts
    Add to Wishlist
    Download
    AI Customize
    Dashboard with bar chart comparing planned vs. actual tasks for projects, pie chart for project share, and a line graph displaying project data.
    Add to Wishlist
    Download
    AI Customize
    Green themed chart layout featuring bar graphs, pie charts, line graphs, and a world map for diverse data visualization.
    Add to Wishlist
    Download
    AI Customize
    Gray slide layout with a semicircular gauge in gradient colors of red, orange, and green, and a sidebar with text.
    Add to Wishlist
    Download
    AI Customize
    Project comparison table with sections for team members, location, costs, and risk before and after changes.
    Add to Wishlist
    Download
    AI Customize
    Executive dashboard with four blue horizontal boxes containing text and a smiling cartoon man gesturing on the right.
    Add to Wishlist
    Download
    AI Customize
    Dashboard with a multi-colored semicircular gauge divided into four sections, labeled 01 to 04, and captions on the right.
    Add to Wishlist
    Download
    AI Customize
    Central tachometer gauge surrounded by six numbered circles in blue, red, teal, orange, purple, and yellow, in an arc layout.
    Add to Wishlist
    Download
    AI Customize
    Business analysis dashboard with a bar chart and an illustrated man holding a pointer in a dark background.
    Add to Wishlist
    Download
    AI Customize
    Dashboard slide with a speedometer gauge in red, blue, yellow, and teal, and text bullet points on the left.
    Add to Wishlist
    Download
    AI Customize
    Green themed diagram illustrating stages of analysis delivery, from data source to client reports and dashboards.
    Add to Wishlist
    Download
    AI Customize
    Dashboard layout with charts, graphs, and a world map in vibrant colors, showcasing data visually.