MILESTONE 🌟 5 Million+ creative minds trust SlideEgg! Grab 80% OFF

Professional Chart Templates PPT for Data Analysis

Chart PowerPoint slide with a horizontal bar chart showing percentages and circular icons representing business categories.
P.ID : 34690
    179 views
    9 Downloads
    Get Custom Slides by Experts
    Enhance Your Presentations with Add-ins
    Google Slides Add-in
    Access templates directly in Google Slides
    Microsoft PowerPoint Add-in
    Access templates directly in PowerPoint
    GPT Add-on
    AI-powered presentation assistance

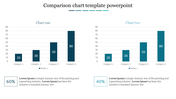
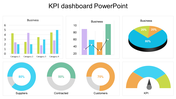
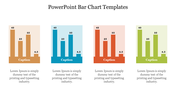
    Chart PowerPoint Template and Google Slides Themes


    Illustrate your data with clarity and precision using our Chart PowerPoint Template. This template features a sleek bar chart design accompanied by descriptive text, providing a visually appealing and informative backdrop for your presentations. 

    Additionally, four circles with titles offer space to discuss various topics related to your data or presentation theme. Against a clean white background, your charts and text will stand out, ensuring maximum impact and comprehension for your audience. Compatible with both PowerPoint and Google Slides, this template offers versatility and ease of use for seamless integration into your presentations. 

    Whether you're presenting financial data, market analysis, or project updates, our Chart PowerPoint Template is the perfect tool to convey your message effectively. Engage your audience and enhance your presentations with this professional and stylish template today!

    Features of the template

    • 100% customizable slides and easy to download.
    • Slides are available in different nodes & colors.
    • The slide contains 16:9 and 4:3 formats.
    • It is easy to change the colors of the slide quickly. 
    • Well-crafted template with an instant download facility.
    Advertisement

    You May Also Like These PowerPoint Templates

    Add to Wishlist
    Download
    AI Customize
    Metrics Dashboard PowerPoint Template & Google Slides
    Add to Wishlist
    Download
    AI Customize
    Slide with colorful bar and line graph, alongside a pie chart, featuring red, teal, blue, and purple elements on white.
    Add to Wishlist
    Download
    AI Customize
    Blank chart slide with a weekly layout from monday to sunday, featuring a grid for scheduling or organizing tasks.
    Free
    Add to Wishlist
    Download
    AI Customize
    Hexagonal radar chart showing five colorful sales metrics at the edges, alongside three numbered captions listed to the left.
    Add to Wishlist
    Download
    AI Customize
    Hoshin Kanri slide with a blue grid design labeled sections for annual objectives and a compass icon at the bottom.
    Free
    Add to Wishlist
    Download
    AI Customize
    Pie Chart Template Free Download PPT And Google Slides
    Add to Wishlist
    Download
    AI Customize
    Bar graph on a slide showing data from 2016 to 2019, with a title about statistics and a caption area section.
    Add to Wishlist
    Download
    AI Customize
    Stacked Bar Chart PowerPoint Template Presentation
    Add to Wishlist
    Download
    AI Customize
    Editable Dot Charts PowerPoint Template For Presentation
    Add to Wishlist
    Download
    AI Customize
    Slide showcasing survey data with percentage figures in colored text boxes and icons with a comparative bar chart.
    Add to Wishlist
    Download
    AI Customize
    Hexagonal web chart with blue and red lines showing financial data for six business areas at the corners.
    Free
    Add to Wishlist
    Download
    AI Customize
    Real estate KPI dashboard showing quarterly data in a green colored pie chart and bar graphs across various categories.
    Add to Wishlist
    Download
    AI Customize
    Change curve diagram mapping emotional responses over time, with stages from shock and denial along a wavy line.
    Add to Wishlist
    Download
    AI Customize
    Innovative Cockpit Charts PowerPoint Download PPT Slides
    Add to Wishlist
    Download
    AI Customize
    A line chart  slide showing data trends across seven items with two percentage indicators with icons and caption areas.
    Add to Wishlist
    Download
    AI Customize
    Bar chart slide showing data trends from 2016 to 2021 with three categories, highlighted in red, teal, and yellow bars.
    Add to Wishlist
    Download
    AI Customize
    Circular progress bar with four colorful concentric rings and percentage labels, surrounded by text areas.