MILESTONE 🌟 5 Million+ creative minds trust SlideEgg! Grab 80% OFF

Our Predesigned Chart Presentation PPT Slide Template

Chart presentation PowerPoint slide featuring a laptop screen and a line graph with categories and series.
P.ID : 33629
    180 views
    2 Downloads
    Get Custom Slides by Experts
    Enhance Your Presentations with Add-ins
    Google Slides Add-in
    Access templates directly in Google Slides
    Microsoft PowerPoint Add-in
    Access templates directly in PowerPoint
    GPT Add-on
    AI-powered presentation assistance

    Present Data with Precision Using Our Chart Presentation Templates


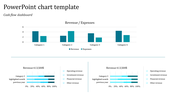
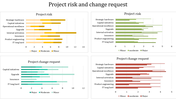
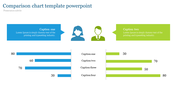
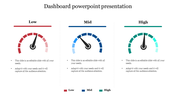
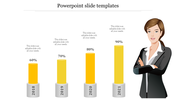
    The Chart Presentation Template and Google Slides Themes are designed to make your data stand out. This template includes an image placeholder, a stats graph, a description text area, and two caption text areas. It is ideal for presenting complex data clearly and engagingly.

    Use this template to effectively visualize your data, making it easier for your audience to understand key insights and trends. The intuitive layout ensures your charts and graphs are the focal points, enhancing the overall impact of your presentation. Whether you’re presenting financial data, market analysis, or performance metrics, this template provides a professional and polished look.

    Features of this template:


    • 100 % customizable slides are easy to download. 
    • Slides are available in different nodes and colors.
    • The slide was contained in 16:9 and 4:3 formats.
    • It is easy to change the slide colors quickly.
    • Well-crafted template with an instant download facility.
    • The clear layout of this template will help you design a professional-looking presentation.
    • The multi-color visuals on this slide will make your presentation eye-catching.
    Advertisement

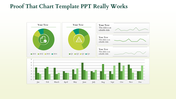
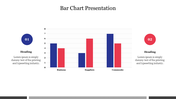
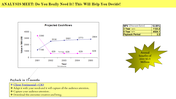
    You May Also Like These PowerPoint Templates

    Free
    Add to Wishlist
    Download
    AI Customize
    3D bar chart PowerPoint template showcasing data in four colored categories with a highlight and captions.
    Free
    Add to Wishlist
    Download
    AI Customize
    KPI dashboard layout with blue semicircle gauges and line charts representing social media performance metrics.
    Free
    Add to Wishlist
    Download
    AI Customize
    Horizontal chart with dual color bars in green and blue, displaying percentage values, and two captions on the right.
    Add to Wishlist
    Download
    AI Customize
    Slide with a vertical bar chart and four labeled sections, each paired with a unique color and icon.
    Add to Wishlist
    Download
    AI Customize
    Dashboard-themed slide with semi-circle charts for business analysis, featuring metrics and reflective silhouettes at the bottom.
    Add to Wishlist
    Download
    AI Customize
    Bar chart infographic with four blue bars for kpi forecasts, a line graph overlay, and a man with a magnifying glass.
    Add to Wishlist
    Download
    AI Customize
    Executive dashboard slide featuring bar graphs and pie charts comparing project data over three years, with text boxes.
    Free
    Add to Wishlist
    Download
    AI Customize
    Market research slide showing a line graph with three levels over the years 2016 and 2019, with a caption box.
    Free
    Add to Wishlist
    Download
    AI Customize
    A blue themed slide featuring a multi year bar chart comparison from 2016 to 2021 with three placeholders below.
    Free
    Add to Wishlist
    Download
    AI Customize
    3D chart with five colored bars in gold, red, green, teal, and orange, on individual bases, displaying percentages above.
    Free
    Add to Wishlist
    Download
    AI Customize
    Five step process chart with titled segments in shades of purple, showing stages and supporting information.
    Add to Wishlist
    Download
    AI Customize
    Innovative KWL Chart PowerPoint Presentation Slide
    Add to Wishlist
    Download
    AI Customize
    Area chart with overlapping blue, teal, and green sections, timeline on the axis, and three labeled boxes below.
    Add to Wishlist
    Download
    AI Customize
    A PowerPoint template displaying growth with stages represented by numbered circles showing data for different stages.
    Add to Wishlist
    Download
    AI Customize
    Color coded KWL chart template with sections for What I Know, What I Want to Know, and What I Learned with placeholder text.
    Add to Wishlist
    Download
    AI Customize
    Pie chart slide showcasing six labeled segments in yellow and gray with surrounding icons, on a blue networked background.
    Add to Wishlist
    Download
    AI Customize
    Pie chart slide with four numbered pie charts in blue, maroon, orange, and red, each linked to a text box with labels.