MILESTONE 🌟 5 Million+ creative minds trust SlideEgg! Grab 80% OFF

Clustered Bar Chart PowerPoint Presentation PPT Slide

Slide with a simple clustered bar chart displaying vertical lines and numerical values for different categories.
P.ID : 35249
    106 views
    1 Downloads
    Get Custom Slides by Experts
    Instantly Access Templates in PowerPoint

    Visualize Data Effectively with Our Chart Presentation Template


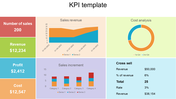
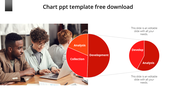
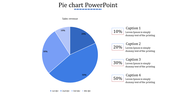
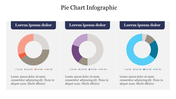
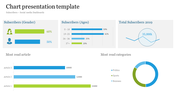
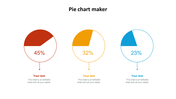
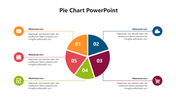
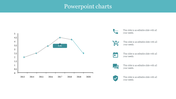
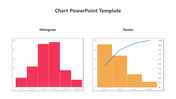
    Charts are essential for presenting data clearly and understandably. The "Chart PowerPoint Presentation Template and Google Slides Themes" features a versatile chart with four distinct categories and dedicated caption text areas. This template allows you to effectively organize and display your data, making complex information accessible and engaging.

    Use this template to highlight trends, compare categories, or illustrate relationships between data points. The professional design ensures that your presentation is visually appealing and easy to follow. Ideal for business reports, academic presentations, and project analyses, this template helps you convey your message with clarity and impact.

    Features of this template:


    • 100 % customizable slides are easy to download. 
    • Slides are available in different nodes and colors.
    • The slide was contained in 16:9 and 4:3 formats.
    • It is easy to change the slide colors quickly.
    • Well-crafted template with an instant download facility.
    • The clear layout of this template will help you design a professional-looking presentation.
    • The multi-color visuals on this slide will make your presentation eye-catching.
    Advertisement

    You May Also Like These PowerPoint Templates

    Add to Wishlist
    Download
    AI Customize
    A pie chart featuring five segments, each labeled with percentages, surrounded by text on a blue background.
    Add to Wishlist
    Download
    AI Customize
    Waterfall PowerPoint chart displaying increases and decreases for eight items with color coded bars for each change.
    Add to Wishlist
    Download
    AI Customize
    Horizontal bar graph slide with four colored steps and corresponding descriptions on the right.
    Add to Wishlist
    Download
    AI Customize
    Sales performance dashboard template in red displaying revenue, recent sales, user data, and session metrics visually.
    Add to Wishlist
    Download
    AI Customize
    Dashboard showing from defect rate trends upto delivery time analysis in mixed orange and brown theme.
    Add to Wishlist
    Download
    AI Customize
    KPI slide with four semi circular gauges displaying metrics and overlapping colored circles showing numerical data.
    Add to Wishlist
    Download
    AI Customize
    KPI dashboard layout with bar charts, a gauge, captions, and target metrics on light gray background, organized in sections.
    Add to Wishlist
    Download
    AI Customize
    Slide with two donut charts displaying values and a text section on the right with a blurred background image.
    Add to Wishlist
    Download
    AI Customize
    Stacked column chart template displaying proportional data distribution across four categories using three series.
    Add to Wishlist
    Download
    AI Customize
    Colorful circular diagram slide illustrating four corporate strategy methods with labels and percentages.
    Add to Wishlist
    Download
    AI Customize
    KWL chart with sections  in blue, green, and red, each column containing placeholder text.
    Add to Wishlist
    Download
    AI Customize
    Vertical bar chart in red shades, displaying yearly data from 2017 to 2020, with detailed labels on the right.
    Add to Wishlist
    Download
    AI Customize
    Dark themed layout featuring four pie charts with shaded segments, each displaying different percentages.
    Add to Wishlist
    Download
    AI Customize
    Stacked traction bar graph with red, blue, green, orange bars labeled with percentage values and caption areas.
    Add to Wishlist
    Download
    AI Customize
    Cash flow dashboard with a vertical bar chart and two horizontal stacked bar charts detailing revenue categories.
    Add to Wishlist
    Download
    AI Customize
    Green shaded bar chart displaying data from 2016 to 2021, with three numbered captions below.
    Add to Wishlist
    Download
    AI Customize
    Chart slide showing market supply data from 2004 to 2014 with red bars and percentage annotations.