Free - Get Modern Drive Presentation Templates Slide Design

Free
Slide with red triangular peaks representing various business metrics and percentage values at the base.
P.ID : 36369
    231 views
    92 Downloads
    Get Custom Slides by Experts
    Instantly Access Templates in PowerPoint

    Elegant Data Theme PowerPoint Templates


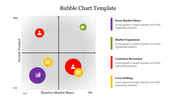
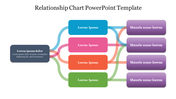
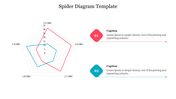
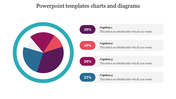
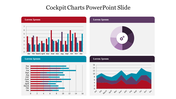
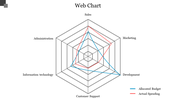
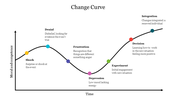
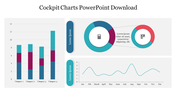
    Elevate your presentations with our Data PowerPoint Templates, the key to unlocking the secrets within your data. These templates are more than a collection of slides; they're your bridge to impactful storytelling. Designed for everyone, from seasoned professionals to young learners, our templates simplify complex data into engaging visuals. Numbers and statistics become vibrant narratives, making learning fun and decision-making a breeze. Whether it's charts, graphs, or infographics, we've covered it all. With user-friendly designs and diverse themes, you'll effortlessly convey your message. Transform data into art, and insights into compelling stories. Dive into the world of data with our free templates and watch your presentations come alive.


    Features of this template:

    • 100% customizable slides and easy to download.
    • Slides available in different nodes & colors.
    • The slide contained 16:9 and 4:3 format.
    • Easy to change the slide colors quickly.
    • Well-crafted template with instant download facility.
    Advertisement

    You May Also Like These PowerPoint Templates

    Add to Wishlist
    Download
    AI Customize
    A line chart  slide showing data trends across seven items with two percentage indicators with icons and caption areas.
    Add to Wishlist
    Download
    AI Customize
    Pricing Strategy chart slide highlighting four key areas from price to promotion with icons in a diamond layout.
    Add to Wishlist
    Download
    AI Customize
    Three outlined boxes in yellow, red, and green, each with circles labeled K, W, and L, at the bottom.
    Add to Wishlist
    Download
    AI Customize
    Timeline chart slide depicting four colored project phases with major milestones and key dates.
    Add to Wishlist
    Download
    AI Customize
    Two line graphs comparing data trends with different colors, featuring seven data points on each chart.
    Free
    Add to Wishlist
    Download
    AI Customize
    Four vertical panels in alternating blue and red colors, showing social media icons with pie charts at the bottom.
    Add to Wishlist
    Download
    AI Customize
    Stacked column chart with three categories, percentage labels, and circular step icons on both sides with percentage figures.
    Add to Wishlist
    Download
    AI Customize
    A stock chart with five vertical bars in orange and teal, representing financial data for a day period.
    Add to Wishlist
    Download
    AI Customize
    Line chart with labeled high and low points across a fluctuating path, illustrating peaks and troughs in data trends.
    Add to Wishlist
    Download
    AI Customize
    Line chart template with two lines and labeled data points, along with caption blocks on the left.
    Add to Wishlist
    Download
    AI Customize
    A line graph showing a plot structure with key points marked by colored dots, representing key stages.
    Free
    Add to Wishlist
    Download
    AI Customize
    Slide deck showcasing KWL chart layouts with colorful sections in purple, yellow, and teal, for structured insights.
    Add to Wishlist
    Download
    AI Customize
    Chart guide slide with two green-tone line graphs displaying data points, captions on the right, and a text footer.
    Add to Wishlist
    Download
    AI Customize
    Steps to growth slide featuring a chart with four arrows indicating yearly growth percentages and a large text section.
    Free
    Add to Wishlist
    Download
    AI Customize
    Comparison bar chart showing percentage values from 2011 to 2019 for chat and security categories.
    Add to Wishlist
    Download
    AI Customize
    Slide showcasing four circular progress charts with percentages in alternating teal and black accents.
    Free
    Add to Wishlist
    Download
    AI Customize
    A slide showing a colorful KWL chart with sections for knowledge, inquiry, and learning outcomes with placeholder text.
    Free
    Add to Wishlist
    Download
    AI Customize
    Pie chart presentation slide showing three charts with percentages with text placeholders.
    Add to Wishlist
    Download
    AI Customize
    A bar chart with four categories displaying stacked colored bars, representing three series in orange, blue, and red.