Free - Technology Infographics Template For PPT And Google Slides
Free

 Canva
Canva
Technology Infographics For Presentation: Data, Process, and System Visualization
Technology presentations usually break down when too much information competes for attention at once. When data, workflows, and systems all need to fit into one presentation, clarity becomes the first problem. This Technology Infographics PowerPoint Template solves that with 30 infographic slides designed to structure complex information into clear visual formats.
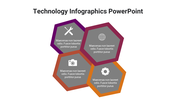
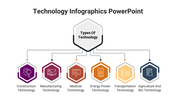
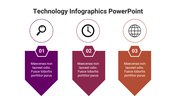
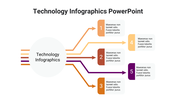
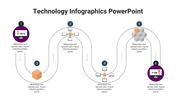
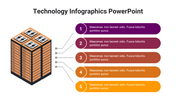
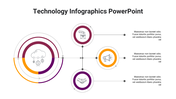
Instead of relying on text-heavy slides, this template uses charts, timelines, flow diagrams, and connected layouts to present technology concepts in a logical sequence. Whether you are explaining growth metrics, system architecture, workflows, or digital trends, each slide is built to guide the audience step by step without confusion.
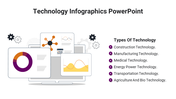
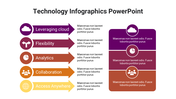
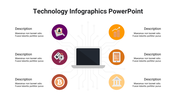
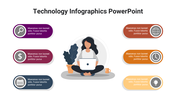
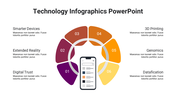
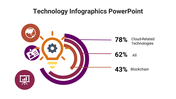
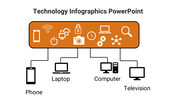
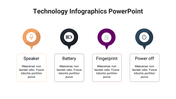
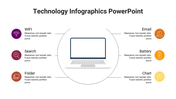
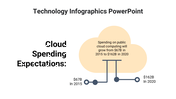
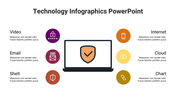
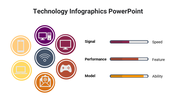
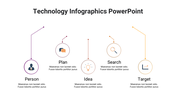
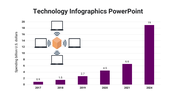
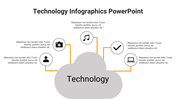
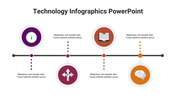
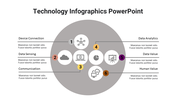
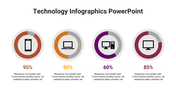
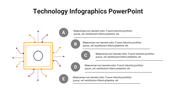
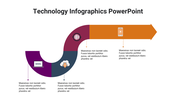
This template includes a mix of data visualization slides, such as bar charts and circular progress indicators, along with process flow layouts that map journeys and operations clearly. System and device connection diagrams help represent networks and integrations, while timeline slides organize information in a structured progression.
A clean white background combined with color-coded elements ensures readability and visual balance, making even dense information easier to absorb. Ideal for business reports, IT presentations, product explanations, and strategy discussions, this template eliminates design effort and helps you deliver structured, professional presentations with clarity.
Choose this template if you need a faster way to turn complex technology data, workflows, and systems into clear, professional slides without building visuals from scratch.
Features of this template:
- Fully editable and customizable slides.
- Compatible with PowerPoint, Google Slides, and Canva.
- Optimized for both 16:9 widescreen and 4:3 standard screens.
- High-resolution, presentation-ready design.
- 30-slide infographic set covering data, process, and system visuals.
- Built-in charts, including bar graphs and circular progress indicators.
- Step-by-step workflow and journey mapping layouts.
- Technology system and device connection diagrams.
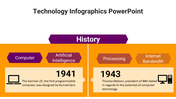
- Timeline and evolution slides for structured storytelling.


You May Also Like These PowerPoint Templates
Free
Add to Wishlist
Download
AI Customize

Add to Wishlist
Download
AI Customize

Free
Add to Wishlist
Download
AI Customize


Add to Wishlist
Download
AI Customize

Free
Add to Wishlist
Download
AI Customize

Add to Wishlist
Download
AI Customize

Add to Wishlist
Download
AI Customize

Add to Wishlist
Download
AI Customize

Free
Add to Wishlist
Download
AI Customize

Add to Wishlist
Download
AI Customize


Free
Add to Wishlist
Download
AI Customize


Add to Wishlist
Download
AI Customize


Free
Add to Wishlist
Download
AI Customize


Free
Add to Wishlist
Download
AI Customize

Add to Wishlist
Download
AI Customize


Add to Wishlist
Download
AI Customize


Free
Add to Wishlist
Download
AI Customize


Add to Wishlist
Download
AI Customize


Add to Wishlist
Download
AI Customize

Free
Add to Wishlist
Download
AI Customize

Add to Wishlist
Download
AI Customize

