Progress Report Presentation Template and Google Slides

Progress Report Presentation Template and Google Slides
P.ID : 56064
    1.2K+ views
    93 Downloads
    Get Custom Slides by Experts
    Instantly Access Templates in PowerPoint

    Effective Progress Report Presentation


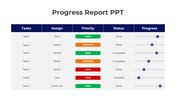
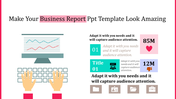
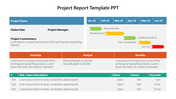
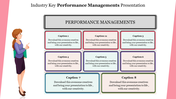
    Progress Report Presentation Download template can be the best template for your exclusive presentation. You can give the template with the results and objectives of your presentation. The template is given with publishing that can easily attract the audience.

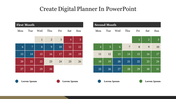
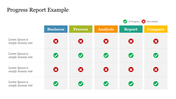
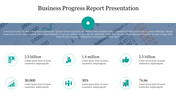
    The added graph design can show your weekly school or the weekly target you have achieved. This template gives crucial information and can be used for professional presentations. This template is fully customized and so editing this template is much easier.

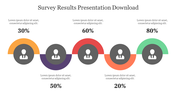
    The user-friendly features can make the presentation even more appealing. Make sure the download is attractive and gains audience attention. Grab now!.

    Features of this template:

    • This template is 100% editable.
    • 100% Customizable (shape color, size & text)
    • It supports an aspect ratio of 16:9.
    • Easily readable and acceptable template.
    • Creative design with vibrant colors.
    • Two nodes with text area.
    Advertisement

    You May Also Like These PowerPoint Templates

    Add to Wishlist
    Download
    AI Customize
    Annual report PowerPoint template featuring financial icon, yearly revenue, and a business meeting background image.
    Add to Wishlist
    Download
    AI Customize
    Weekly planner slide with five vertical columns, in green, orange, pink, purple, and blue, labeled Monday to Friday.
    Add to Wishlist
    Download
    AI Customize
    Timing PowerPoint slide with a daily schedule table and an illustration of a person sitting next to an hourglass.
    Add to Wishlist
    Download
    AI Customize
    Annual report presentation showing sales revenue graph, yearly sales report, and product performance comparison.
    Add to Wishlist
    Download
    AI Customize
    Finance report slide displaying a table of expenses, net income, and profit from 2013 to 2019, with a bar chart below.
    Free
    Add to Wishlist
    Download
    AI Customize
    Graphic displaying annual report sheets, a colorful bar chart, green blocks and a pink magnifying glass.
    Free
    Add to Wishlist
    Download
    AI Customize
    Slide with a colorful circular chart divided into orange, green, red, and blue segments, centered with a black bar chart.
    Add to Wishlist
    Download
    AI Customize
    Horizontal table with metric labels in colorful blocks on the left and status bars with descriptions on the right.
    Add to Wishlist
    Download
    AI Customize
    Effective Business Report Sample PPT Presentation Slide
    Add to Wishlist
    Download
    AI Customize
    Quarterly report slide with a vertical red arrow marking Q1 to Q4 in colorful circles and text rows on a teal background.
    Add to Wishlist
    Download
    AI Customize
    Six-step supply chain process with hexagonal segments connected by a timeline, from raw materials to purchase.
    Add to Wishlist
    Download
    AI Customize
    Project status report template with a timeline graph from 2016 to 2025 and colored bars indicating monthly progress.
    Add to Wishlist
    Download
    AI Customize
    Medical icons arranged in square buttons on the left, with case report bullet points on the right in a green background.
    Add to Wishlist
    Download
    AI Customize
    Organized weekly planner with days listed in blue tabs and an illustration of two people planning.
    Add to Wishlist
    Download
    AI Customize
    Annual report slide featuring a financial summary with categories, budget, expenses, and net earnings in a table format.
    Add to Wishlist
    Download
    AI Customize
    Survey results show percentage breakdowns for categories with corresponding figures and brief descriptions.
    Add to Wishlist
    Download
    AI Customize
    Annual report template featuring financial metrics, performance comparisons, and graphical data visualizations.
    Add to Wishlist
    Download
    AI Customize
    Financial report slide with key performance indicators along with additional metrics showing divident and ratio.