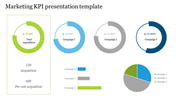
Editable PowerPoint Speedometer Template for Data Analysis

 Canva
Canva
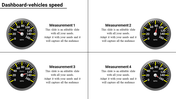
PowerPoint Speedometer Template and Google Slides
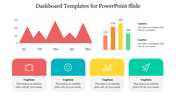
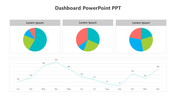
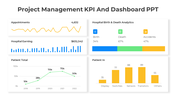
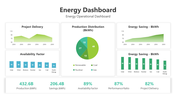
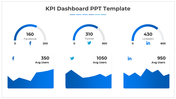
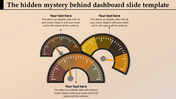
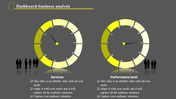
Accelerate your presentations with our dynamic template, meticulously designed to gauge progress and performance with precision. Featuring three speedometers, each adorned with percentages and text areas, our template provides a clear visual representation of key metrics and indicators.
Against a backdrop of pristine white, your data takes center stage, ensuring maximum visibility and clarity. Whether you're tracking project milestones, measuring KPIs, or evaluating performance metrics, our template empowers you to convey information effectively and efficiently.
Perfect for project status updates, performance reviews, or dashboard presentations, our Speedometer Template enables you to drive your presentations forward with confidence and impact. Download the PowerPoint Speedometer Template and Google Slides today, and accelerate your presentations with visuals that propel your message towards success.
Features of the template
- 100% customizable slides and easy to download.
- Slides are available in different nodes & colors.
- The slide contains 16:9 and 4:3 formats.
- It is easy to change the colors of the slide quickly.
- Well-crafted template with an instant download facility.


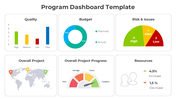
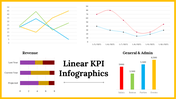
You May Also Like These PowerPoint Templates
Add to Wishlist
Download
Edit

Add to Wishlist
Download
Edit

Add to Wishlist
Download
Edit


Add to Wishlist
Download
Edit

Add to Wishlist
Download
Edit

Add to Wishlist
Download
Edit

Add to Wishlist
Download
Edit

Add to Wishlist
Download
Edit

Add to Wishlist
Download
Edit

Add to Wishlist
Download
Edit


Add to Wishlist
Download
Edit

Add to Wishlist
Download
Edit

Add to Wishlist
Download
Edit

Add to Wishlist
Download
Edit

Add to Wishlist
Download
Edit

Add to Wishlist
Download
Edit

Add to Wishlist
Download
Edit

Add to Wishlist
Download
Edit
