PowerPoint Speedometer Template for Performance Tracking

Gray speedometer infographic with a large central gauge and three smaller gauges displaying percentages.
P.ID : 17001
    161 views
    4 Downloads
    Get Custom Slides by Experts
    Instantly Access Templates in PowerPoint

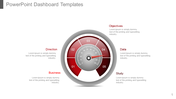
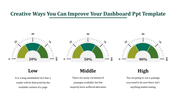
    KPI Speedometer Presentation Template


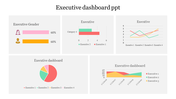
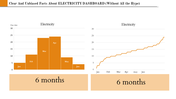
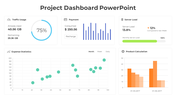
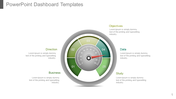
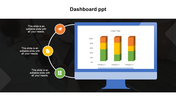
    Upgrade your data presentations with our Speedometer PowerPoint Template and Google Slides. Say goodbye to boring charts and hello to dynamic visuals. This dashboard presentation template makes it super easy to showcase progress, performance, and key metrics. With its clean layout and customizable features, you can create a striking representation of your data story. Whether you're a business analyst, project manager, or student, this template is your go-to tool.

    Simply adjust colors, and needles, and input your data for a clear and engaging presentation. It's versatile, user-friendly, and perfect for any industry or topic. Plus, it seamlessly integrates with your existing materials. Ready to elevate your presentations? Download the template today and unlock the power of visual storytelling! Check out our wide range of professional templates to find your perfect match for communicating data with confidence.

    Features of the template:

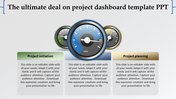
    • Slides are available in different nodes & colors.
    • Easy to change the slide colors.
    • Well-crafted template with instant download.
    Advertisement

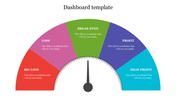
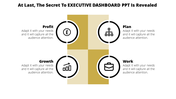
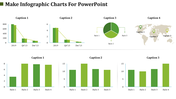
    You May Also Like These PowerPoint Templates

    Free
    Add to Wishlist
    Download
    AI Customize
    PowerPoint slide with a project dashboard showing two speedometers to represent project progress with captions.
    Add to Wishlist
    Download
    AI Customize
    KPI dashboard with bar graphs showing data trends over time and two green summary boxes.
    Free
    Add to Wishlist
    Download
    AI Customize
    Dashboard PPT template featuring a speedometer with labeled sections like Direction, Objectives, Data, Business, and Study.
    Add to Wishlist
    Download
    AI Customize
    Vehicle dashboard slide featuring a speedometer on the left and a detailed table on the right with its brands.
    Add to Wishlist
    Download
    AI Customize
    KPI template showing a bar chart with four cases, and two circular progress indicators in blue and orange showing percentage.
    Add to Wishlist
    Download
    AI Customize
    A slide displaying dashboard elements like bar graphs, a world map with data points, and progress bars, with captions.
    Add to Wishlist
    Download
    AI Customize
    Marketing KPI dashboard comparing Google, Facebook, and Bing ads, featuring clicks, cost, line charts, and campaign analysis.
    Add to Wishlist
    Download
    AI Customize
    Slide with multiple charts including bar, line, and pie charts illustrating data for hires, turnover, and training.
    Add to Wishlist
    Download
    AI Customize
    Orange speedometer slide with a gauge showing 70% progress and space for caption text below.
    Free
    Add to Wishlist
    Download
    AI Customize
    Visual of project phases and value generation over time, with milestones labeled as planning, detailing, and implementation.
    Free
    Add to Wishlist
    Download
    AI Customize
    Tachometer PowerPoint slide featuring a colorful gauge with segments labeled with space for captions on a white backdrop.
    Add to Wishlist
    Download
    AI Customize
    Business slide with four sections representing different concepts Equality, Human Rights, Independent, and Multi Party.
    Add to Wishlist
    Download
    AI Customize
    Executive dashboard with a pie chart, vertical and horizontal bar graph, and a waterfall chart, displaying various data.
    Add to Wishlist
    Download
    AI Customize
    Dashboard slide with metrics for social media, including followers, engagement, impressions, and reviews in charts.
    Add to Wishlist
    Download
    AI Customize
    Executive dashboard slide displaying colorful charts for executing dashboard to quality.
    Add to Wishlist
    Download
    AI Customize
    Business dashboard featuring a profile card, three financial metrics, a 67% circular chart, and a dual-colored area graph.
    Add to Wishlist
    Download
    AI Customize
    KPI PPT slide featuring circular progress indicators and a table of data values with captions on a white backdrop.