MILESTONE 🌟 5 Million+ creative minds trust SlideEgg! Grab 80% OFF

Innovative PowerPoint Charts Presentation Template Design

Slide with bar and line charts showcasing data trends from January to December, paired with text on the right.
P.ID : 9250
    307 views
    9 Downloads
    Get Custom Slides by Experts
    Instantly Access Templates in PowerPoint

    Chart PowerPoint Template


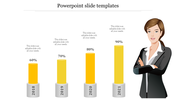
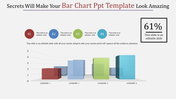
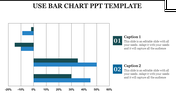
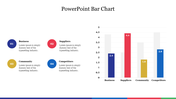
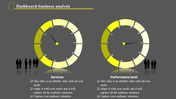
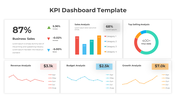
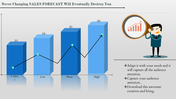
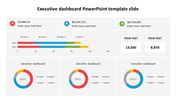
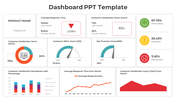
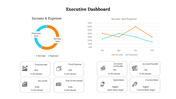
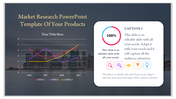
    Introducing our PowerPoint Chart Template, a dynamic tool designed to visually engage your audience with its unique combination of graphs and bars in one template. This two-in-one process captivates viewers, making your presentations mesmerizing and impactful.


    Featuring ample space for text and a large title, our template ensures that your key points are conveyed effectively and prominently. Whether you're presenting data trends, market analysis, or project metrics, this template provides a clear and compelling visual representation.


    Don't miss out on the opportunity to elevate your presentations to the next level. Grab our PowerPoint Chart Template now and impress your audience with visually stunning and informative slides.


    Features of the template

    • 100% customizable slides and easy to download.
    • Slides are available in different nodes & colors.
    • The slide contains 16:9 and 4:3 formats.
    • It is easy to change the colors of the slide quickly. 
    • Well-crafted template with an instant download facility.

    Advertisement

    You May Also Like These PowerPoint Templates

    Add to Wishlist
    Download
    AI Customize
    Slide with blue stats on the left and various charts, including bar and pie charts in different colors.
    Add to Wishlist
    Download
    AI Customize
    Comprehensive project dashboard template with progress charts, data bars, and financial performance indicators.
    Free
    Add to Wishlist
    Download
    AI Customize
    A blue themed slide featuring a multi year bar chart comparison from 2016 to 2021 with three placeholders below.
    Free
    Add to Wishlist
    Download
    AI Customize
    3D chart with five colored bars in gold, red, green, teal, and orange, on individual bases, displaying percentages above.
    Add to Wishlist
    Download
    AI Customize
    KPI Dashboard slide displaying metrics with bar charts and line graphs for key business indicators.
    Free
    Add to Wishlist
    Download
    AI Customize
    Five step process chart with titled segments in shades of purple, showing stages and supporting information.
    Add to Wishlist
    Download
    AI Customize
    Innovative KWL Chart PowerPoint Presentation Slide
    Add to Wishlist
    Download
    AI Customize
    Area chart with overlapping blue, teal, and green sections, timeline on the axis, and three labeled boxes below.
    Add to Wishlist
    Download
    AI Customize
    A PowerPoint template displaying growth with stages represented by numbered circles showing data for different stages.
    Add to Wishlist
    Download
    AI Customize
    Color coded KWL chart template with sections for What I Know, What I Want to Know, and What I Learned with placeholder text.
    Add to Wishlist
    Download
    AI Customize
    Pie chart slide showcasing six labeled segments in yellow and gray with surrounding icons, on a blue networked background.
    Add to Wishlist
    Download
    AI Customize
    Pie chart slide with four numbered pie charts in blue, maroon, orange, and red, each linked to a text box with labels.
    Add to Wishlist
    Download
    AI Customize
    A slide with a line chart slide showing data for Category 1 to 2 over several years with placeholder text.
    Add to Wishlist
    Download
    AI Customize
    Innovative Pie Chart Presentation Example Slide PPT
    Add to Wishlist
    Download
    AI Customize
    PowerPoint slide featuring four bar charts with different colors and captions, each representing different data percentages.
    Add to Wishlist
    Download
    AI Customize
    Scatter plot with differently sized bubbles in orange and purple, with a legend and product descriptions to the side.