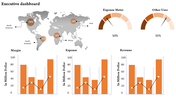
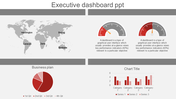
Interactive Dashboard Slide Template for Effective Reporting

Green dashboard template featuring three semicircular meters with needles pointing to various levels, on a dark backdrop.
P.ID : 17079
    281 views
    6 Downloads
    Get Custom Slides by Experts
    Instantly Access Templates in PowerPoint

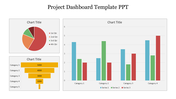
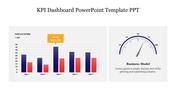
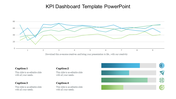
    Dashboard PowerPoint Template and Google Slides


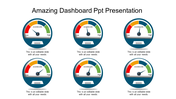
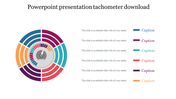
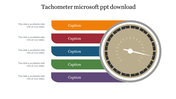
    The Multi-Meter Dashboard Template offers a clear and organized layout, perfect for anyone who wants to showcase key metrics, track progress toward goals, and present data in a visually compelling way.  This template features a prominent dashboard with three distinct meters. Each meter is displayed at a different value point and has a designated caption area below it labeled "Caption 1," "Caption 2," and "Caption 3." These captions allow you to clearly define what each meter represents, giving context to the data you're presenting.

    The Multi-Meter Dashboard Template is a valuable tool for many professionals. Business professionals and consultants can use it to present key performance indicators (KPIs) clearly and concisely, track progress toward strategic objectives, and leverage data to inform decision-making. Marketing and sales teams can benefit by using the template to monitor campaign performance metrics, visually represent sales figures, and showcase customer satisfaction levels.

    Features of this template:


    • 100 % customizable slides are easy to download. 
    • Slides are available in different nodes and colors.
    • The slide was contained in 16:9 and 4:3 formats.
    • It is easy to change the slide colors quickly.
    • Well-crafted template with an instant download facility.
    • The clear layout of this template will help you design a professional-looking presentation.
    • The multi-color visuals on this slide will make your presentation eye-catching.
    Advertisement

    You May Also Like These PowerPoint Templates

    Add to Wishlist
    Download
    AI Customize
    Speedometer template with a needle pointing at 70%, featuring a section in a whote backdrop for a caption areas.
    Add to Wishlist
    Download
    AI Customize
    Speedometer template with four gauges displaying percentages: blue at 70%, orange at 50%, dark red at 55%, and red at 85%.
    Add to Wishlist
    Download
    AI Customize
    Project dashboard with colorful bar charts, tables in red and purple, a circular gauge, and four blue phase icons below.
    Free
    Add to Wishlist
    Download
    AI Customize
     Row of colorful tachometers with different needle positions, each paired with a corresponding caption box.
    Add to Wishlist
    Download
    AI Customize
    Creative KPI Dashboard PPT And Google Slides Template
    Add to Wishlist
    Download
    AI Customize
    KPI Dashboard PPT slide displaying project analysis, revenue, profitability, and gap analysis with data visualizations.
    Add to Wishlist
    Download
    AI Customize
    Business KPI dashboard showcasing charts for real estate and page views with pie, bar, and line graph visualizations.
    Add to Wishlist
    Download
    AI Customize
    Executive dashboard slide displaying many charts from new business to operational expenses.
    Add to Wishlist
    Download
    AI Customize
    Colorful infographic with a line graph, pie and bar chart, and numerical data panels in a structured KPI template design.
    Add to Wishlist
    Download
    AI Customize
    Dashboard template showing sales, orders, visitors, and users metrics with visual bar and pie charts for website analysis.
    Add to Wishlist
    Download
    AI Customize
    Dashboard template with a semi-circular gauge indicating performance with a blurred image and caption areas.
    Add to Wishlist
    Download
    AI Customize
    Dashboard slide showing plant growth data with details table and area chart for Zantedeschia, Celosia, and Calendula.
    Add to Wishlist
    Download
    AI Customize
    Colorful Tachometer slide with color coded sections from light to BMI with placeholder text.
    Add to Wishlist
    Download
    AI Customize
    Slide with three tachometer dials in blue, purple, and pink, each aligned above a matching caption box.
    Add to Wishlist
    Download
    AI Customize
    Dashboard graphics displaying vehicle speeds with a data table listing vehicles, brands, and status.
    Free
    Add to Wishlist
    Download
    AI Customize
    Four vertical pointed icons in red, blue, purple, and orange, each aligned with caption on a light background.
    Add to Wishlist
    Download
    AI Customize
    Project dashboard slides with Gantt chart, a burndown chart, and a timeline, using a palette of brown, green, and red.