Buy Creative PowerPoint Charts with Five Node

Chart with five vertical green bars showing growth percentages, labeled 1 to 5 with descriptions on the right.
P.ID : 8367
    224 views
    11 Downloads
    Get Custom Slides by Experts
    Instantly Access Templates in PowerPoint

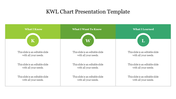
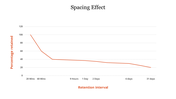
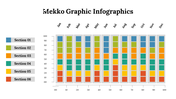
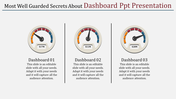
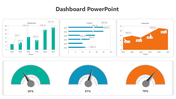
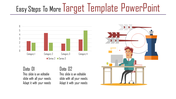
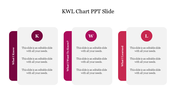
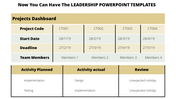
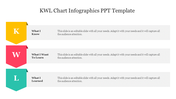
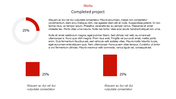
    Chart PowerPoint Template


    Elevate your presentations with our dynamic PowerPoint Chart. Designed for clarity and impact, it showcases a bar graph with five nodes, each representing a different data point or category. Tailored for visualizing data and trends, it enables effective communication of information to your audience.


    The bar graph includes percentages, providing clear insights into each data point. Each node is colored to enhance visual appeal and differentiation. With ample space for text, you can elaborate on your data or provide additional context.


    Ideal for analysts, presenters, and professionals needing to showcase data and trends in a visually engaging manner. Download now and enhance your presentations with clarity and style!


    Features of the template

    • 100% customizable slides and easy to download.
    • Slides are available in different nodes & colors.
    • The slide contains 16:9 and 4:3 formats.
    • It is easy to change the colors of the slide quickly. 
    • Well-crafted template with an instant download facility.

    Advertisement

    You May Also Like These PowerPoint Templates

    Add to Wishlist
    Download
    AI Customize
    PowerPoint slide with multiple charts and graphs, including a line chart, bar chart, and area chart, each with captions.
    Add to Wishlist
    Download
    AI Customize
    PPT slide with a line chart illustrating trends for three series, using red, blue, and yellow lines with a caption.
    Add to Wishlist
    Download
    AI Customize
    Technology slide featuring a line graph with data points and percentages, set against a grayscale geometric pattern.
    Add to Wishlist
    Download
    AI Customize
    Project Gantt chart PPT slide showing project tasks, progress percentages, and timelines for November and December 2020.
    Add to Wishlist
    Download
    AI Customize
    Laptop screen displaying a blue bar chart, surrounded by business dashboard elements placed in dark background.
    Add to Wishlist
    Download
    AI Customize
    Chart slide featuring a weekly schedule with multiple rows and columns with placeholder text gradient blue and green bars.
    Add to Wishlist
    Download
    AI Customize
    Editable PowerPoint Chart Templates For Presentation
    Add to Wishlist
    Download
    AI Customize
    Infographic with bar charts, percentage stats, and a layered blue 3D smartphone like structure with four captions.
    Add to Wishlist
    Download
    AI Customize
    Slide featuring two line graphs and bar charts in green, comparing data across months and quarters.
    Add to Wishlist
    Download
    AI Customize
    PowerPoint slide with a bar chart showing data for 2017, 2018, 2019, and 2020 in colorful bars.
    Add to Wishlist
    Download
    AI Customize
    Chart design slide tracking article likes, comments, shares, total posts, and new subscriber growth with visual graphs.
    Add to Wishlist
    Download
    AI Customize
    Chart presentation template with a bar graph showing the progress of four projects with percentages.
    Free
    Add to Wishlist
    Download
    AI Customize
    Line chart template with three data series in blue, teal, black, and text sections.
    Add to Wishlist
    Download
    AI Customize
    Chart PPT template with bar graphs showing clicks and recipients, a pie chart for email categories, and a line graph.