Chart PPT Presentation Template for Data Visualization

Chart slide with subscriber metrics, list rating statistics, and bar graphs comparing monthly subscribers and unsubscribers.
P.ID : 34120
    199 views
    11 Downloads
    Get Custom Slides by Experts
    Instantly Access Templates in PowerPoint

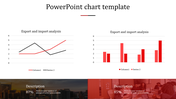
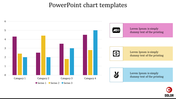
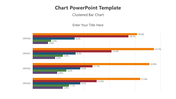
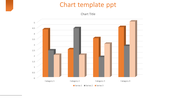
    Chart Presentation Template


    Enhance your business data to bring results, by introducing the Chart Presentation PPT And Google Slides. The slide has two detailed bar charts. Each of them displays scale values and percentage variations. Ideal for analysts, financial experts, business consultants and educators. Suitable for presenting statistical analyses, market trends, and performance metrics in meetings, reports and educational settings. 

    Helpful for illustrating financial performance, market share analysis or project metrics. Download to make use of the template for client presentations and academic lectures.

    Features of the template

    • The slide contains 16:9 and 4:3 formats.
    • Compatible with Google slide themes and PowerPoint.
    • 100% customizable slides and free to download.
    • It is easy to change the colors of the slide quickly.
    • Well-crafted template with an instant download facility.
    Advertisement

    You May Also Like These PowerPoint Templates

    Add to Wishlist
    Download
    AI Customize
    Infographic with four bar graphs, each showing data points A to D, and captions areas in green boxes.
    Add to Wishlist
    Download
    AI Customize
    Dashboard with a bar chart and pie chart in purple shades, comparing project status across regional shares.
    Free
    Add to Wishlist
    Download
    AI Customize
    PowerPoint presentation slide featuring a stacked bar chart, aerial landscape photo, and a comparison table of drone data.
    Free
    Add to Wishlist
    Download
    AI Customize
    PowerPoint slide with a circular pie chart showing four segments labeled with percentages and a placeholder text.
    Add to Wishlist
    Download
    AI Customize
    Customized Kubler Ross PowerPoint Presentation Template
    Add to Wishlist
    Download
    AI Customize
    Visual of boost engagement growth with stacked bar categories: newsletter sign-ups, premium customers, and followers.
    Add to Wishlist
    Download
    AI Customize
    Pie charts showing data percentages for growth, with three percentage values with placeholder text.
    Add to Wishlist
    Download
    AI Customize
    A medical themed PowerPoint slide with three colorful circular progress bars showing percentages, each with related icons.
    Free
    Add to Wishlist
    Download
    AI Customize
    Chart infographic with four drop shaped gauge style meters in blue, green, yellow, and red, each with text below.
    Add to Wishlist
    Download
    AI Customize
    Dual chart template slide with scatter and bubble charts, the scatter chart on the left and the bubble chart on the right.
    Free
    Add to Wishlist
    Download
    AI Customize
    Slide with green and white sections, featuring pie and bar charts, and an engine image in the bottom right corner.
    Free
    Add to Wishlist
    Download
    AI Customize
    Infographic with a circular segmented chart in blue shades, centered around an AI head graphic placed in white background.
    Add to Wishlist
    Download
    AI Customize
    Executive dashboard presentation slide with arrows and title placeholders on a notebook background.
    Add to Wishlist
    Download
    AI Customize
    Three vertical rectangular sections with headers in green, blue, and orange, each with captions inside.
    Add to Wishlist
    Download
    AI Customize
    Colorful pie chart PowerPoint slide with five labeled sections and captions on a white backdrop.