MILESTONE 🌟 5 Million+ creative minds trust SlideEgg! Grab 80% OFF

The 4M1E PowerPoint Presentation And Google Slides

Pack of 13 slides
P.ID : 75283
Advertisement
1 views
1 Downloads
Get Custom Slides by Experts
Instantly Access Templates in PowerPoint

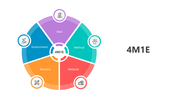
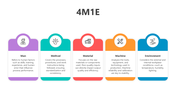
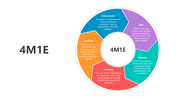
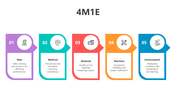
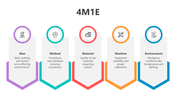
4M1E PowerPoint, Google Slides, And Canva Template


4M1E is a structured root cause analysis method used in quality control and problem-solving processes. It focuses on analyzing five key factors—Man, Machine, Method, Material, and Environment—that could influence product quality or process performance. Widely used in manufacturing and industrial engineering, 4M1E supports lean initiatives and enhances operational consistency by identifying and mitigating sources of variation.

Purpose Of The Slides

This 13-slide 4M1E presentation template is designed to help you clearly communicate the elements and applications of the 4M1E framework. Whether you're mapping out cause-and-effect relationships, conducting failure analysis, or preparing for an internal audit, these slides offer a clean layout to visualize each factor in detail. It’s an excellent tool for brainstorming sessions, continuous improvement meetings, and quality reviews.

Who Can Use It?

This template is perfect for quality engineers, production supervisors, Six Sigma professionals, industrial trainers, and operations managers. It also benefits students and educators in quality management, mechanical engineering, and business operations. Whether you're working on a process audit or a classroom presentation, this slide deck will elevate your analysis with professional visuals.


Special Key Features

Download the 4M1E slide deck to simplify complex quality discussions. The pack includes editable diagrams, clear data placeholders, and bold icons to present your information with impact. Each slide allows you to explore one element or map all factors on a single visual chart for instant clarity and engagement.


Present your quality insights like a pro—grab the 4M1E template now and drive data-backed decisions with confidence!


Features of this template


  • 100% customizable slides and easy to download.
  • The slides contain 16:9 and 4:3 formats.
  • Easy to change the colors quickly.
  • Highly compatible with PowerPoint, Google Slides, and Canva templates.

You May Also Like These PowerPoint Templates

Add to Wishlist
Download
AI Customize
 slide featuring three circular charts for data analysis, followed by a line chart displaying monthly trends.
Add to Wishlist
Download
AI Customize
Magnifying glass with two speech bubbles on the left and four colored analysis sections with checkmark icons on the right.
Free
Add to Wishlist
Download
AI Customize
Add to Wishlist
Download
AI Customize
Infographic showing seven-step performance cycle in a circular layout, each step marked with colored numbers and labels.
Add to Wishlist
Download
AI Customize
Slide featuring five colorful cylindrical bar charts labeled with data analytics categories with percentages from 23% to 75%.
Add to Wishlist
Download
AI Customize
Slide with an orange upright and a purple inverted triangle, each featuring icons and four numbered captions around them.
Add to Wishlist
Download
AI Customize
Five numbered hexagons in red, orange, green, teal, and blue, each with text inside.
Add to Wishlist
Download
AI Customize
Performance slide with four quadrants in red, green, teal, and blue, connected in a circular flow with relevant text.
Add to Wishlist
Download
AI Customize
A market analysis slide featuring visual data representation with charts illustrating quantitative statistics with captions.
Free
Add to Wishlist
Download
AI Customize
Competitor analysis chart slide comparing four companies across various categories.
Add to Wishlist
Download
AI Customize
Financial slide deck with a navy blue theme, featuring sections on company mission, analysis types, and team profiles.
Add to Wishlist
Download
AI Customize
Pack of slides with colorful icons and sections for various data analysis, including visuals and layouts.
Add to Wishlist
Download
AI Customize
Market analysis infographic with a yellow open box at the bottom, connected to four colored captions labeled 1 to 4.
Free
Add to Wishlist
Download
AI Customize
Vertical bar chart with five captions and a magnifying glass highlighting one, and numbered list with text on the right.
Add to Wishlist
Download
AI Customize
Hexagon layout with captions in teal, blue, and pink, connected to numbered nodes on a dotted gray background.