Amazing Simple Gantt Chart PowerPoint Presentation

Gantt chart showing tasks in two categories with blue columns for priority, progress, dates, and responsible persons.
P.ID : 46829
    213 views
    29 Downloads
    Get Custom Slides by Experts
    Instantly Access Templates in PowerPoint

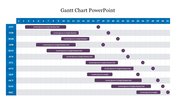
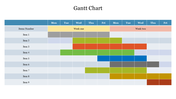
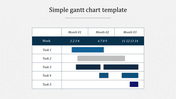
    Editable Table Format Gantt Chart Slide 

    Plan and schedule your projects more effectively with this simple Gantt chart slide. It is an excellent project management tool that can help you improve resource allocation, task delegation, monitoring, determining resources, etc. This slide has a simple Gantt chart in cool white and blue colors to present the tasks, categories, priorities, progress, dates, and assigned people. This editable slide has dummy text in the columns, which are all replaceable with your own data. It is also helpful to manage the dependencies between the tasks. Start downloading to make the best of it!

    Features of the template

    • 100% customizable slides and easy to download.
    • Slides are available in different nodes & colors.
    • The slide contains 16:9 and 4:3 formats.
    • Easy to change the colors of the slide quickly.
    • Well-crafted template with an instant download facility.
    • Simple layout makes it easy to follow.
    Advertisement

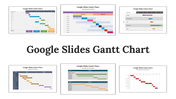
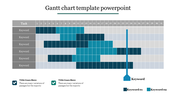
    You May Also Like These PowerPoint Templates

    Add to Wishlist
    Download
    AI Customize
    Gantt chart slide with horizontal gray task bars and percentage completion for months in a color coded header.
    Add to Wishlist
    Download
    AI Customize
    Gantt chart displaying task progress for seven steps, each represented by colored bars spanning from January to June.
    Add to Wishlist
    Download
    AI Customize
    Gantt chart template showing tasks with percentage completion values, organized along a thirty one days colored timeline.
    Add to Wishlist
    Download
    AI Customize
    Slide with a chart layout showing timeline across four weeks, with tasks in blue, green, yellow, and orange bars.
    Add to Wishlist
    Download
    AI Customize
    Horizontal gantt chart displaying six projects with colored bars showing timelines across months.
    Add to Wishlist
    Download
    AI Customize
    Gantt chart displaying tasks with varying progress percentages over a 31-day timeline using colored bars.
    Add to Wishlist
    Download
    AI Customize
    Project timeline Gantt chart divided into two halves, showcasing task completion levels with gray progress bars.
    Add to Wishlist
    Download
    AI Customize
    Attractive Gantt Chart Sample PowerPoint Presentation
    Add to Wishlist
    Download
    AI Customize
    Gantt chart with seven tasks and their corresponding timeframes, shown in color-coded bars for each day in March 2021.
    Add to Wishlist
    Download
    AI Customize
    Editable Gantt Chart PowerPoint Presentation Template
    Free
    Add to Wishlist
    Download
    AI Customize
    Gantt chart with six colorful horizontal bars representing tasks over months from March to November.
    Add to Wishlist
    Download
    AI Customize
    Gantt chart slide with six tasks, showing their timelines in weeks, using colored bars for task durations across four weeks.
    Free
    Add to Wishlist
    Download
    AI Customize
    Gantt chart slide with tasks organized by three-month timeline and color-coded progress bars.
    Add to Wishlist
    Download
    AI Customize
    Gantt chart with colorful horizontal bars showing project tasks across months and milestones highlighted below.
    Free
    Add to Wishlist
    Download
    AI Customize
    Timeline Gantt chart for project management showing progress of tasks over 8 weeks using color-coded task statuses.
    Add to Wishlist
    Download
    AI Customize
    Gantt chart PowerPoint slide with tasks assigned across days of the week, with color coded bars and sample text descriptions.