Customized PPT Chart Templates Presentation Slide Design

 Canva
Canva
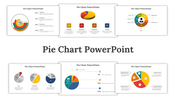

Dynamic Chart PowerPoint Template
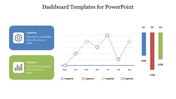
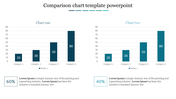
Embark on a visual journey of data mastery with our Chart Dynamics PowerPoint template. Tailored for analysts, presenters, and data enthusiasts, this template seamlessly integrates form and function to transform your data into compelling visual narratives. Perfect for business reports, academic presentations, and project updates, it elevates the art of data representation with contemporary design.
Illuminate your data with a harmonious blend of colors, fonts, and graphical elements, ensuring each chart communicates your insights effectively. Tailored for analysts, presenters, and anyone keen on making data-driven presentations, this template transforms your charts into visually compelling stories.
Navigate through your presentation seamlessly with our user-friendly layout, providing easy transitions between different charts while maintaining a cohesive and polished look. The Chart Dynamics PowerPoint template is your go-to tool for making a lasting impression with the power of data and contemporary design.
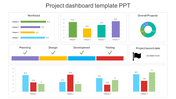
Features of the template
- 100% customizable slides and easy to download.
- Slides are available in different nodes & colors.
- The slide contains 16:9 and 4:3 formats.
- It is easy to change the colors of the slide quickly.
- Well-crafted template with an instant download facility.


You May Also Like These PowerPoint Templates


