Financial Report Presentation Template PPT and Google Slides

Financial report slide with a gray and teal color scheme, showing a table comparing key metrics from FY18 to FY24.
P.ID : 31587
    21 slides
    Slide deck with images of money, tax forms, and strategies for both individuals and businesses, with purple theme
    13 slides
    Cost saving initiatives slides featuring a piggy bank with coins being inserted, along with various colorful diagram layouts.
    16 slides
    A pack of internal audit processes slides illustrated with various diagram models and colorful layout designs.
    16 slides
    Financial management slides using colorful icons like piggy banks, dollar signs, and flowcharts to represent processes.
    6.1K+ views
    885 Downloads
    Get Custom Slides by Experts
    Instantly Access Templates in PowerPoint

    Seven Noded Financial Report PowerPoint Slide

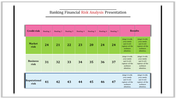
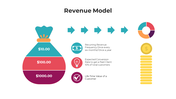
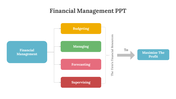
    Download this clean and professional Financial Report Presentation Template to create a visually appealing presentation. It provides the necessary structure for a financial statement. The goal of this report slide is to show the transformation of the revenue into profit. This fully editable slide is ideal for any business, whether a startup or a large corporation.

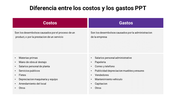
    The Financial Report Presentation Template has a well-designed table with a pleasant gray background. It has enough rows and columns to present information about your target market, net revenue, financial cost, total expenses, etc. The values given in this slide are 100% editable. You can edit them according to your needs. You can also try our Cost Analysis Template to make financial presentations.

    Features of this template:

    1. 100% customizable slides and easy to download.
    2. Slides available in different nodes & colors.
    3. The slide contained 16:9 and 4:3 format.
    4. Easy to change the slide colors quickly.
    5. Well-crafted template with instant download facility.
    6. It has a pre-designed table format. 
    Advertisement

    You May Also Like These PowerPoint Templates

    Add to Wishlist
    Download
    AI Customize
    Infographic on digital wallet slide featuring benefits with pie charts showing user opinions centered around a phone.
    Add to Wishlist
    Download
    AI Customize
    Cost analysis slide with a balanced scale, showing stacked coins on one side and a growth chart on the other with text area.
    Add to Wishlist
    Download
    AI Customize
    A slide showing an invoice template with sections for item descriptions including payment details at the bottom.
    Add to Wishlist
    Download
    AI Customize
    Revenue streams slide diagram with six colorful arrows pointing towards a central icon of stacked coins and text area.
    Free
    Add to Wishlist
    Download
    AI Customize
    An illustration of a man watering plants symbolizing different investments with placeholder text.
    Free
    Add to Wishlist
    Download
    AI Customize
    Budget slide with three columns in red, blue, and orange, each with text and amounts listed below.
    Add to Wishlist
    Download
    AI Customize
    Loan request slide featuring a pie chart showing percentage distribution and a table with amount details required and raised.
    Add to Wishlist
    Download
    AI Customize
    Audit presentation with a person reviewing files and another using a laptop, with nine bullet points on the right.
    Add to Wishlist
    Download
    AI Customize
    Blue outline of a bucket in the center, with four text boxes in purple, green, orange, and red placed around it.
    Add to Wishlist
    Download
    AI Customize
    Account Receivable Google Slides and PowerPoint Templates
    Add to Wishlist
    Download
    AI Customize
    Non profit organization chart with a central circle and various non profit categories arranged on both sides.
    Add to Wishlist
    Download
    AI Customize
    Best Financial Crisis Presentation PowerPoint Template
    Add to Wishlist
    Download
    AI Customize
    Economics slides featuring a dark background with financial graphs and icons for different economic systems.
    Add to Wishlist
    Download
    AI Customize
    An informative slide outlining the ten key steps of conducting a cost benefit analysis is presented in a grid format.
    Add to Wishlist
    Download
    AI Customize
    Stack of U.S. dollars on the left side, with two salary-related icons and placeholder text on the right side.
    Add to Wishlist
    Download
    AI Customize
    Cash flow statement slide with a timeline of financial elements cash flow, balance sheet, income, and equity with icons.