Corporate Annual Financial Report PPT And Google Slides








An Annual Financial Report Presentation Built Around the Numbers a Board Actually Asks For
Annual results rarely fail because the figures are wrong. They fail because the story stops at the income statement. This corporate annual financial report presentation runs a full reporting sequence — headline performance, statement detail, liquidity, ratios, and the year ahead — across nine content slides, in a dark navy and green treatment that keeps dense tables legible when projected.
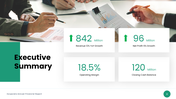
It opens on an executive summary carrying revenue, net profit, operating margin, and closing cash balance as four headline tiles, then a company overview with founding year, headcount, and positioning.
From there, the deck works through the reporting layers:
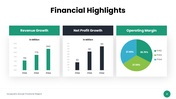
- Compare three years of revenue and net profit growth against operating margin in a single highlights view.
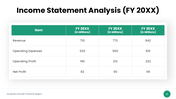
- Break the income statement into revenue, operating expenses, operating profit, and net profit across three fiscal years.
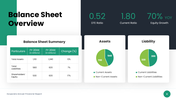
- Read the balance sheet through debt-to-equity, current ratio, and equity growth, with assets and liabilities split current versus non-current on paired donut charts.
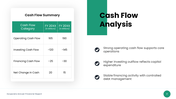
- Track operating, investing, and financing cash flows year on year, with room beside the table for three commentary points.
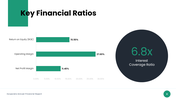
- Set return on equity, operating margin, and net profit margin side by side, with interest coverage isolated as a single figure.
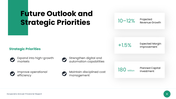
- Close on four strategic priorities tied to projected revenue growth, expected margin improvement, and planned capital investment.
Every table and chart arrives populated with sample figures against FY 20XX placeholders, so the structure reads correctly before a single number is replaced.
This suits CFOs and finance managers building board packs, accountants and consultants reporting to clients, and founders presenting a full year to investors.
Beyond the content slides, the pack carries SlideEgg's standard extras — icon libraries, shape-editing guidance, and licence terms — bringing it to 18 slides in total.
Edit the figures, charts, and commentary in PowerPoint, Google Slides, or Canva, or open it through SlideEgg's Edit option to adjust it online before downloading.
For reporting at other intervals, browse the Financials PowerPoint Template. If you need a single-view summary rather than a full report, the Executive Financial Dashboard condenses the same metrics onto one screen.
Give the board a year they can follow from revenue to strategy without anyone asking for the spreadsheet.
Explore Related Collections
Recommended based on this template.


You May Also Like These PowerPoint Templates

Showing36 of69,218 templates