Informative Relative Valuation PowerPoint And Google Slides



 Canva
Canva
A Relative Valuation Presentation That Argues Both Sides of the Method
Valuing a company against its peers is the fastest route to an answer and one of the easiest routes to a wrong one. This deck treats the method honestly across five content slides — the multiples, what the approach does well, where it breaks down, where it's heading, and how to actually run it.
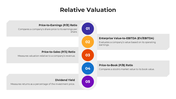
It opens on the five multiples an analyst reaches for, each with a one-line definition: price-to-earnings, enterprise value to EBITDA, price-to-sales, price-to-book, and dividend yield.
From there, it puts the case and the countercase side by side:
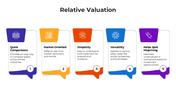
- Five advantages – quick comparison across similar industries, real-time market orientation, simplicity for analysts and investors, versatility across stocks, property and whole businesses, and the ability to surface mispricing.
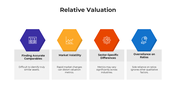
- Four limitations, given equal weight: the difficulty of finding genuinely comparable assets, distortion from market volatility, metrics that shift between sectors, and overreliance on ratios at the expense of qualitative judgement.
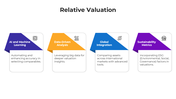
- Four forces reshaping the practice: machine learning applied to comparable selection, big-data analysis, cross-border comparison, and ESG factors entering the valuation itself.
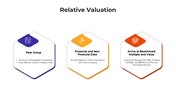
The closing slide is the one an analyst will actually work from: a three-step method running from peer group definition (size, nature, growth, margin, and risk), through financial and non-financial inputs (annual reports and direct discussion with the company), to arriving at a benchmark multiple — with the options laid out across P/E, P/BV, P/Sales, EV/EBIT, EV/EBITDA, EV/tonne and EV/subscriber.
Navy, amber, red, blue, and violet carry the four groupings, so each argument keeps its own colour as the deck moves between them.
The method plus caveats make this suited to equity research training, an investment committee briefing, a corporate finance or valuation lecture, or the analysis section of an M&A discussion.
The remaining slides hold SlideEgg's standard extras — icon libraries, shape-editing guidance, and licence terms.
Edit the multiples, definitions, and colour blocks in PowerPoint or Google Slides, or adjust the deck through SlideEgg's Edit option before downloading.
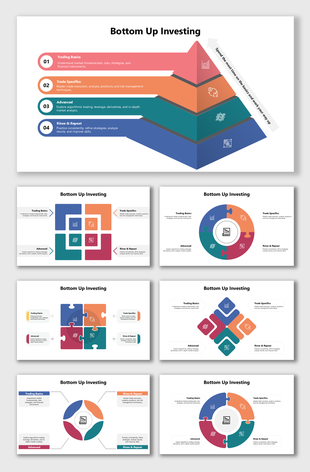
For the modelling discipline that sits behind these numbers, see Financial Modelling. For the company-level analysis that feeds a peer comparison, Bottom-Up Investing picks up the thread. The full set sits in Financials PowerPoint Templates.


You May Also Like These PowerPoint Templates



Showing36 of69,218 templates