Free - Financial Performance PowerPoint Template and Google Slides
Free

 Canva
Canva
Financial Performance Presentation Template
What is this deck good for?
Financial performance slides are usually used when someone has to answer simple but important questions:
- Are we growing?
- Are we profitable?
- Are costs under control?
- Is cash getting tighter?
- Are receivables and payables moving in the right direction?
- Are we hitting budget and ratio targets?
This deck is built for that type of review.
What can you show with it?
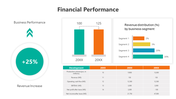
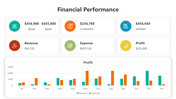
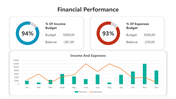
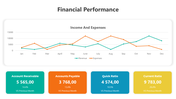
The layouts support several layers of performance reporting. Some slides work well for headline metrics such as revenue, profit, customer data, vendor data, and margin. Others are better for monthly movement in income and expenses, budget tracking, liquidity ratios, segment mix, and year-based comparison. That matters because a finance review rarely stays at one level. Senior leaders may want the summary first, while managers may need the supporting trend.
Why does that help in real meetings?
A financial review becomes slow when every number sits in a separate table or spreadsheet. These slides reduce that problem by grouping related signals together. A viewer can see operating trends, compare categories, and spot pressure points without moving across multiple documents.
How is the slide deck structured?
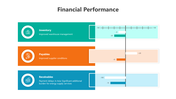
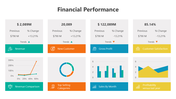
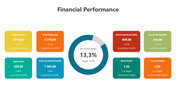
The deck includes KPI cards, donut-style visuals, line charts, bar charts, summary panels, and comparison blocks. That mix makes it easier to choose the right layout for the type of point being presented, whether the focus is on monthly reporting, budget use, profitability, or working capital.
Where does it fit best?
Useful for monthly business reviews, finance team updates, management reporting, board prep, internal performance tracking, and consultant-led reporting.
Use these slides when the goal is to turn financial data into a review format that is faster to read and easier to discuss.
Features of this template:
- Fully editable financial performance slides.
- Available in 16:9 and 4:3 formats.
- Compatible with PowerPoint, Google Slides, and Canva.
- Covers revenue, profit, expenses, receivables, payables, margin, budget, and liquidity review.
- Includes KPI cards, donut charts, bar charts, line graphs, and summary comparison layouts.
- Useful for monthly reporting, management review, board prep, and internal finance updates.
- Helps present both headline metrics and supporting trends in one deck.
- Designed for performance-focused reporting rather than generic finance slides.
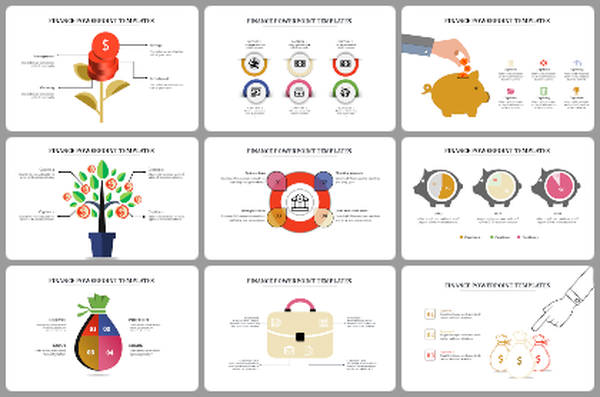
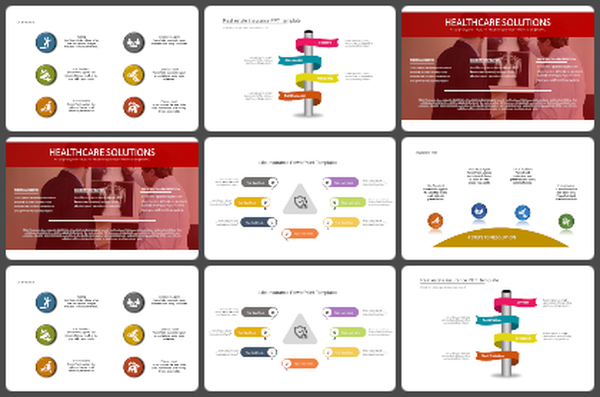
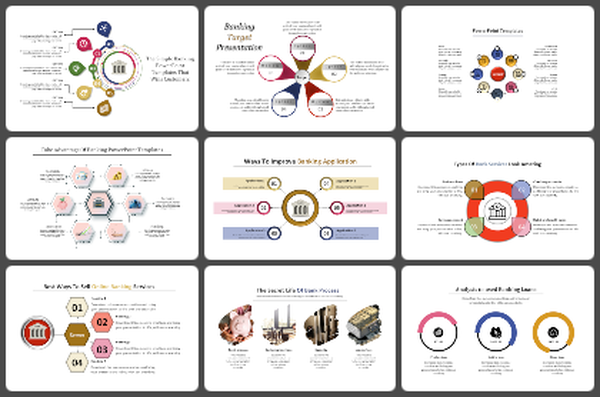
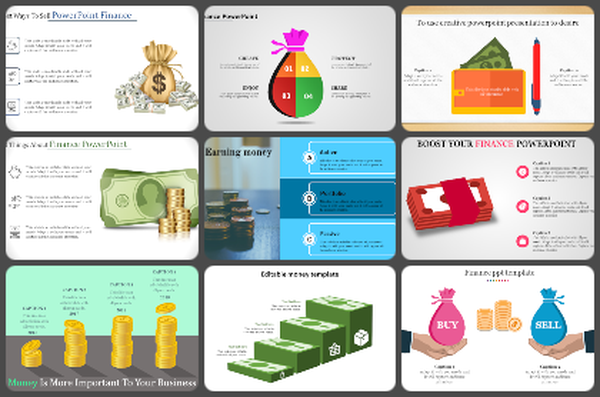
You May Also Like These PowerPoint Templates
Add to Wishlist
Download
AI Customize

Add to Wishlist
Download
AI Customize

Free
Add to Wishlist
Download
AI Customize

Add to Wishlist
Download
AI Customize

Add to Wishlist
Download
AI Customize

Add to Wishlist
Download
AI Customize


Add to Wishlist
Download
AI Customize

Add to Wishlist
Download
AI Customize

Add to Wishlist
Download
AI Customize

Free
Add to Wishlist
Download
AI Customize

Free
Add to Wishlist
Download
AI Customize

Free
Add to Wishlist
Download
AI Customize

Add to Wishlist
Download
AI Customize

Add to Wishlist
Download
AI Customize

Add to Wishlist
Download
AI Customize

Add to Wishlist
Download
AI Customize

Add to Wishlist
Download
AI Customize

Add to Wishlist
Download
AI Customize

Add to Wishlist
Download
AI Customize

Add to Wishlist
Download
AI Customize

Add to Wishlist
Download
AI Customize

Add to Wishlist
Download
AI Customize

Add to Wishlist
Download
AI Customize

Add to Wishlist
Download
AI Customize


Add to Wishlist
Download
AI Customize

Add to Wishlist
Download
AI Customize


Add to Wishlist
Download
AI Customize


Free
Add to Wishlist
Download
AI Customize


Add to Wishlist
Download
AI Customize

Add to Wishlist
Download
AI Customize

Add to Wishlist
Download
AI Customize
