Dashboard Presentation Template and Google Slides Themes

Streamline Data Visualization: Dashboard Template
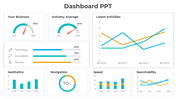
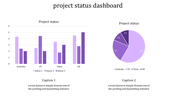
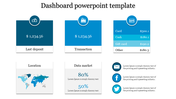
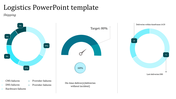
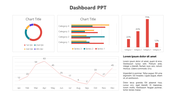
Dashboards offer a concise overview of key metrics and data points. Download our Dashboard Presentation Template and Google Slides Themes, featuring a sleek blue-themed graph divided into four sections. Each section is accompanied by an icon, percentage level, and text area, allowing users to present complex data with clarity and precision.
Ideal for business professionals, analysts, and project managers seeking to streamline data visualization and enhance decision-making processes. Whether presenting quarterly performance metrics, project milestones, or financial projections, our template empowers users to create visually impactful presentations that resonate with their audience.
Features of the template
- 100% customizable slides are easy to download.
- Slides are available in different colors.
- The slide has 4:3 and 16:9 formats.
- It is easy to change the slide colors quickly.
- It has a cute design to impress an audience.
- Create feature-rich, animated presentations.


You May Also Like These PowerPoint Templates
Add to Wishlist
Download
Edit

Add to Wishlist
Download
Edit


Add to Wishlist
Download
Edit

Add to Wishlist
Download
Edit

Add to Wishlist
Download
Edit

Add to Wishlist
Download
Edit

Add to Wishlist
Download
Edit


Add to Wishlist
Download
Edit

Add to Wishlist
Download
Edit

Add to Wishlist
Download
Edit

Add to Wishlist
Download
Edit

Add to Wishlist
Download
Edit

Add to Wishlist
Download
Edit

Add to Wishlist
Download
Edit

Add to Wishlist
Download
Edit

Add to Wishlist
Download
Edit

Add to Wishlist
Download
Edit

Add to Wishlist
Download
Edit
