Best Social Media Report PowerPoint Template Designs

Social media reports slide, including color coded bar charts for followers, age demographics, and engagement statistics.
P.ID : 34138
    7.7K+ views
    1.1K+ Downloads
    Get Custom Slides by Experts
    Instantly Access Templates in PowerPoint

    Social Media Report Presentation Slide

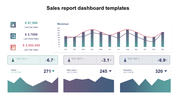
    Are you ready to unveil the secrets of social media engagement? The social media report can provide insightful data and trends that can help your business thrive in the digital age. It will help you discover key metrics, audience behavior, and content strategies that will boost your online presence. Our social media report template offers a visually engaging way to present your findings and impress your audience. It is an essential tool to revolutionize your social media game!


      Features of the template

      • 100% customizable slides and easy to download.
      • Slides are available in different nodes & colors.
      • The slide contains 16:9 and 4:3 formats.
      • Easy to change the colors of the slide quickly.
      • Well-crafted template with an instant download facility.
      • Highly compatible with all versions of PowerPoint.
      • It has charts and tables for easy reference.
      • Professional-looking slide.
      Advertisement

      You May Also Like These PowerPoint Templates

      Add to Wishlist
      Download
      AI Customize
      Annual report timeline infographic showing five speech bubbles with percentages 40%, 50%, 55%, 60%, 70% from 2015 to 2019.
      Add to Wishlist
      Download
      AI Customize
      Company Annual Report slide featuring sales data, revenue graphs, and gross profit analysis for 20XX.
      Add to Wishlist
      Download
      AI Customize
      Our Predesigned Business Report PowerPoint Template
      Add to Wishlist
      Download
      AI Customize
      Company annual report presentation template with a red, white, and black theme, featuring multiple slides.
      Add to Wishlist
      Download
      AI Customize
      Progress Report Presentation Template and Google Slides
      Add to Wishlist
      Download
      AI Customize
      Annual report slide featuring a colorful fan shaped graphic numbered 01 to 05, and text highlighting financial elements.
      Add to Wishlist
      Download
      AI Customize
      Annual report presentation slides on company strategy, growth, core values, and key facts with icons.
      Free
      Add to Wishlist
      Download
      AI Customize
      Sales performance presentation with six blue circles, each containing an icon and caption.
      Add to Wishlist
      Download
      AI Customize
      Best Business Report Infographics PowerPoint Presentation
      Add to Wishlist
      Download
      AI Customize
      Four people seated in a circle using devices, with captions in colored boxes of pink, green, teal, and yellow.
      Free
      Add to Wishlist
      Download
      AI Customize
      A circular 3D chart in blue, green, purple, and orange representing yearly expansion categories and values.
      Add to Wishlist
      Download
      AI Customize
      Business report slide featuring a laptop displaying an analytics dashboard, a smartphone on the desk, and a pink section.
      Add to Wishlist
      Download
      AI Customize
      Colorful timeline with year labels from 2012 to 2020, connected by a curved line and two circular captons below.
      Free
      Add to Wishlist
      Download
      AI Customize
      Four 3D bar columns in brown, orange, red, and gray with paint icons above and percentage labels, alongside text sections.
      Add to Wishlist
      Download
      AI Customize
      Company Annual Report slide featuring sections for overview, financial review, team management, and service offerings.
      Free
      Add to Wishlist
      Download
      AI Customize
      Annual report slide displaying a bar chart with color-coded percentages from 30% to 80% and caption areas.
      Add to Wishlist
      Download
      AI Customize
      The slide features a colorful donut chart, a table with captions and checkmarks, and a bar graph with a title text area.