PowerPoint Template For Survey Results and Google Slides

Survey results slide featuring four circular percentage values in different colors with text boxes for placeholder text.
P.ID : 58137
    6K+ views
    569 Downloads
    Get Custom Slides by Experts
    Instantly Access Templates in PowerPoint

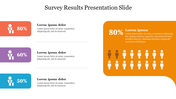
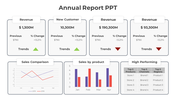
    Survey Results Presentation Slide

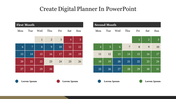
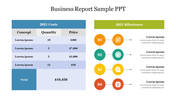
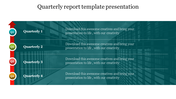
    Survey results are the outcome of a survey conducted to collect data and feedback from a sample population about a particular topic or issue. The results of a survey can be used to gain insight into public opinion, consumer behavior, market trends, and more. They can also be used to inform decision-making and policy development. By using this template you can convey your message in a clear and concise manner.


    Features of the template:

    1. 100% customizable slides and easy to download.
    2. Easy to change the slide's colors.
    3. The slide contained 16:9 and 4:3 format.
    4. Highly compatible with PowerPoint.
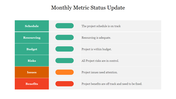
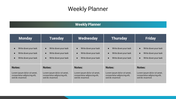
    5. This slide has a colorful design pattern.

    Advertisement

    You May Also Like These PowerPoint Templates

    Add to Wishlist
    Download
    AI Customize
    Slide featuring a central monochrome document icon with captions, surrounded by four images showcasing data analysis scenes.
    Add to Wishlist
    Download
    AI Customize
    Best Infographic Survey PowerPoint Template
    Add to Wishlist
    Download
    AI Customize
    Business report template with a monthly timeline chart and three pie charts below with percentages segments.
    Add to Wishlist
    Download
    AI Customize
    Sales performance review slide with key metrics such as revenue, new customers, gross profit, and customer satisfaction.
    Add to Wishlist
    Download
    AI Customize
    Progress report slide with a circular profile image and a four row, three column table with colored bars on the right.
    Add to Wishlist
    Download
    AI Customize
    Slide featuring financial and project overviews with blue circular progress charts, and image of various graphs on the side.
    Add to Wishlist
    Download
    AI Customize
    Survey results template featuring percentages and icons, with 80% represented visually in a red block on the right.
    Add to Wishlist
    Download
    AI Customize
    Split layout with a multicolored pie chart showing five data percentages and a textual checklist in a blue section.
    Free
    Add to Wishlist
    Download
    AI Customize
    Weekly report layout with a goals checklist on the left and a yellow bordered table for days and columns on the right.
    Add to Wishlist
    Download
    AI Customize
    Charts and graphs displaying total sales, revenue, and lead sources in an annual report presentation slide.
    Add to Wishlist
    Download
    AI Customize
    Colorful pyramid chart with five levels, each topped with a percentage and connected to icons on the right.
    Free
    Add to Wishlist
    Download
    AI Customize
    Sales performance chart with a central briefcase featuring interconnected yellow circles with icons and captions areas.
    Free
    Add to Wishlist
    Download
    AI Customize
    Sales performance review slide with four bullet points on the left and a line chart showing growth on the right.
    Add to Wishlist
    Download
    AI Customize
    Yearly financial report slide with key figures and graphical data on shareholder returns and business line earnings.
    Add to Wishlist
    Download
    AI Customize
    A teal status report slide with a donut chart showing percentages and a table on the right detailing project phases.