Modern PowerPoint Speedometer Template for Presentation


Speedometer PowerPoint Template and Google Slides
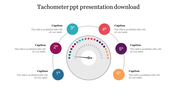
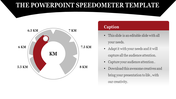
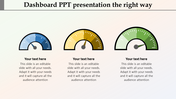
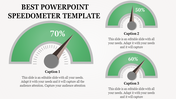
The Simple Speedometer Template offers a straightforward layout, perfect for anyone who wants to showcase their growth, achievements, or performance in an impactful way. This template features a large speedometer with a clear percentage value displayed on it. Below the speedometer, there's a dedicated text area for a caption. This allows you to explain what the speedometer represents, such as sales growth, project completion, or customer satisfaction.
The Simple Speedometer Template is a valuable tool for many professionals. Sales and marketing teams can use it to track sales growth, monitor key performance indicators (KPIs), and showcase their progress toward achieving sales goals. Project managers and team leaders can benefit by using the template to communicate project progress to stakeholders, visually represent task completion percentages, and keep everyone informed about project status.
Features of this template:
- 100 % customizable slides are easy to download.
- Slides are available in different nodes and colors.
- The slide was contained in 16:9 and 4:3 formats.
- It is easy to change the slide colors quickly.
- Well-crafted template with an instant download facility.
- The clear layout of this template will help you design a professional-looking presentation.
- The multi-color visuals on this slide will make your presentation eye-catching.


You May Also Like These PowerPoint Templates
Add to Wishlist
Download
AI Customize

Add to Wishlist
Download
AI Customize

Add to Wishlist
Download
AI Customize

Add to Wishlist
Download
AI Customize

Add to Wishlist
Download
AI Customize

Add to Wishlist
Download
AI Customize

Add to Wishlist
Download
AI Customize


Add to Wishlist
Download
AI Customize

Add to Wishlist
Download
AI Customize

Add to Wishlist
Download
AI Customize

Add to Wishlist
Download
AI Customize

Add to Wishlist
Download
AI Customize

Add to Wishlist
Download
AI Customize

Free
Add to Wishlist
Download
AI Customize

Add to Wishlist
Download
AI Customize

Add to Wishlist
Download
AI Customize

Add to Wishlist
Download
AI Customize

Add to Wishlist
Download
AI Customize

