MILESTONE 🌟 5 Million+ creative minds trust SlideEgg! Grab 80% OFF

Puzzle shape PowerPoint charts template and Google slides

Chart with colored X symbols in blue and grey, arranged horizontally in four rows, representing percentage values.
P.ID : 7485
    266 views
    6 Downloads
    Get Custom Slides by Experts
    Instantly Access Templates in PowerPoint

    Puzzle piece PowerPoint charts  presentation template


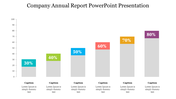
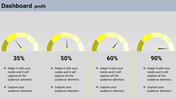
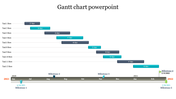
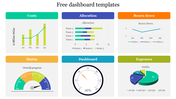
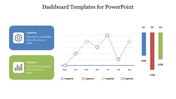
    Finding it difficult to turn data into clear and interesting presentations? Look no further! This premium PowerPoint charts come with a puzzle pieces layout for each chart which makes them easy to edit and visually appealing. Ideal for teachers, students, business professionals, or anyone who wants to make their data stand out, these editable charts help you present information in a clear and memorable way. Forget about the complicated charts and concentrate on your message! Download these powerful PowerPoint charts and your presentations will become impressive, informative slides that will leave a deep impression on your audience. Communicate visually. Download Now.

    Features of the template


    • 100% customizable slides and easy to download.
    • The slides contain 16:9 and 4:3 formats.
    • Easy to change the colors quickly.
    • It is a well-crafted template with an instant download facility.
    • It is a 100% pre-designed slide.
    • The slide holds vibrant colors.
    Advertisement

    You May Also Like These PowerPoint Templates

    Free
    Add to Wishlist
    Download
    AI Customize
    KPI dashboard slide showcasing various business metrics through colorful bar charts, pie charts, and a gauge meter.
    Add to Wishlist
    Download
    AI Customize
    KPI format slide displaying financial performance metrics with detailed charts and figures.
    Add to Wishlist
    Download
    AI Customize
    Smart chart template slide showing bar and line charts labeled net profit alongside numbered caption area.
    Add to Wishlist
    Download
    AI Customize
    A bubble chart slide with four quadrants featuring colorful icons for key business strategies with a placeholder text area.
    Add to Wishlist
    Download
    AI Customize
    SmartArt pie chart showing 65% in red and 35% in green as a and b, with placeholder captions and a text box.
    Add to Wishlist
    Download
    AI Customize
    Radar PowerPoint Presentation Templates and Google Slides
    Add to Wishlist
    Download
    AI Customize
    Pentagon-shaped spider chart displaying two datasets in red and blue with two numbered caption areas.
    Add to Wishlist
    Download
    AI Customize
    Slide featuring a blue umbrella graphic with three labeled sections and two text boxes on the right.
    Free
    Add to Wishlist
    Download
    AI Customize
    Four vertical bar charts in orange, blue, red, and green on a white background, each with captions below.
    Add to Wishlist
    Download
    AI Customize
    Colorful pie chart with four segments in blue, purple, red, and orange, with matching text boxes showing percentages.
    Add to Wishlist
    Download
    AI Customize
    Metrics Dashboard PowerPoint Template & Google Slides
    Add to Wishlist
    Download
    AI Customize
    Slide with colorful bar and line graph, alongside a pie chart, featuring red, teal, blue, and purple elements on white.
    Add to Wishlist
    Download
    AI Customize
    Blank chart slide with a weekly layout from monday to sunday, featuring a grid for scheduling or organizing tasks.
    Free
    Add to Wishlist
    Download
    AI Customize
    Hexagonal radar chart showing five colorful sales metrics at the edges, alongside three numbered captions listed to the left.
    Add to Wishlist
    Download
    AI Customize
    Hoshin Kanri slide with a blue grid design labeled sections for annual objectives and a compass icon at the bottom.
    Free
    Add to Wishlist
    Download
    AI Customize
    Pie Chart Template Free Download PPT And Google Slides
    Add to Wishlist
    Download
    AI Customize
    Bar graph on a slide showing data from 2016 to 2019, with a title about statistics and a caption area section.
    Add to Wishlist
    Download
    AI Customize
    Stacked Bar Chart PowerPoint Template Presentation