Best Pie Chart Presentation Template and Google Slides Themes

Red ring pie chart displaying car sales percentages with a central car graphic, caption areas and brand labels.
P.ID : 28120
    102 views
    2 Downloads
    Get Custom Slides by Experts
    Instantly Access Templates in PowerPoint

    Pie Chart Presentation Template and Google Slides Themes


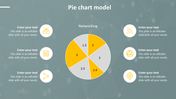
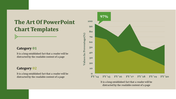
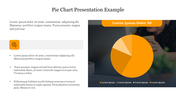
    Create Impactful Presentations with Pie Chart Presentation Templates. A pie chart presentation is a great way to show data visually. Our Presentation template, with a green circle diagram featuring a car image in the middle, percentage points around it, and a list of car company names to the right, helps you present your data clearly and attractively.

    What Is a Pie Chart Presentation?

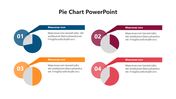
    A pie chart presentation uses a circular graph to show data, making it easy to compare different parts. This type of presentation is perfect for showing how different pieces contribute to a whole.

    Purpose of the Slide

    The main purpose of this slide is to display data in a simple and appealing way. The pie chart breaks down complex information into easy-to-understand segments, ideal for showing market shares, survey results, or financial data.

    Who Can Use These Templates?

    It’s especially useful for business analysts, marketers, financial advisors, and researchers. The professional design makes your data easy to understand, and suitable for business.

    Improve your presentations with this easy-to-use tool.

    Features of the template

    • 100% customizable slides and easy to download.
    • Slides are available in different nodes & colors.
    • The slide contains 16:9 and 4:3 formats.
    • It is easy to change the colors of the slide quickly. 
    • Well-crafted template with an instant download facility.
    Advertisement

    You May Also Like These PowerPoint Templates

    Add to Wishlist
    Download
    AI Customize
    KWL chart slide with three light gray boxes, featuring maroon headers and side labels for knowledge tracking.
    Add to Wishlist
    Download
    AI Customize
    Executive dashboard slide displaying project details including start date, deadline, team members, and activities.
    Add to Wishlist
    Download
    AI Customize
    Cute Pie Chart  Diagram PowerPoint Presentation Template
    Add to Wishlist
    Download
    AI Customize
    KWL Chart Infographics PPT Template For Presentation
    Add to Wishlist
    Download
    AI Customize
    EDITABLE TRACTION POWERPOINT DESIGN TEMPLATES
    Add to Wishlist
    Download
    AI Customize
    Sales performance dashboard PPT template with a colorful circular segmented chart and percentage indicators with icons.
    Add to Wishlist
    Download
    AI Customize
    Green themed dashboard template with three plant growth in line, bar and area chart for different years and species.
    Free
    Add to Wishlist
    Download
    AI Customize
    Slide with a circular chart and two bars, highlighted in red, with progress indicator and explanatory text beside.
    Add to Wishlist
    Download
    AI Customize
    Dashboard template with two horizontal bar charts, a calendar icon, and circular progress indicators in orange and green.
    Add to Wishlist
    Download
    AI Customize
    PowerPoint slide with multiple charts and graphs, including a line chart, bar chart, and area chart, each with captions.
    Add to Wishlist
    Download
    AI Customize
    PPT slide with a line chart illustrating trends for three series, using red, blue, and yellow lines with a caption.
    Add to Wishlist
    Download
    AI Customize
    Technology slide featuring a line graph with data points and percentages, set against a grayscale geometric pattern.
    Add to Wishlist
    Download
    AI Customize
    Project Gantt chart PPT slide showing project tasks, progress percentages, and timelines for November and December 2020.
    Add to Wishlist
    Download
    AI Customize
    Pie chart on the left with four colored sections and percentages, alongside steps with matching colors on the right.
    Add to Wishlist
    Download
    AI Customize
    Laptop screen displaying a blue bar chart, surrounded by business dashboard elements placed in dark background.
    Add to Wishlist
    Download
    AI Customize
    Chart slide featuring a weekly schedule with multiple rows and columns with placeholder text gradient blue and green bars.
    Add to Wishlist
    Download
    AI Customize
    Editable PowerPoint Chart Templates For Presentation
    Add to Wishlist
    Download
    AI Customize
    Infographic with bar charts, percentage stats, and a layered blue 3D smartphone like structure with four captions.