Easy To Use This Professional Fishbone RCA PowerPoint

Fishbone diagram template with labeled categories branching to identify causes of treatment delays.
P.ID : 69293
    222 views
    23 Downloads
    Get Custom Slides by Experts
    Instantly Access Templates in PowerPoint

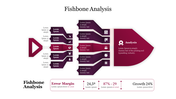
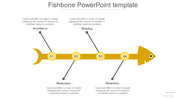
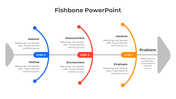
    Fishbone RCA PowerPoint Infographics

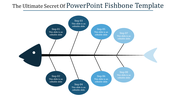
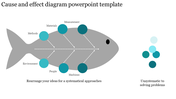
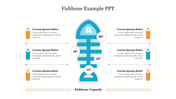
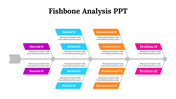
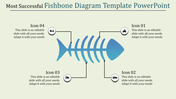
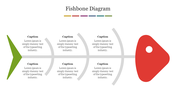
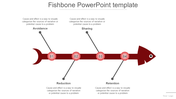
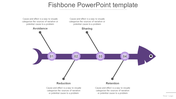
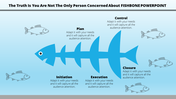
    Do you know the other names of the fishbone diagram? The other names are the cause-and-effect diagram and the Ishikawa diagram. It is a powerful visual aid that helps to analyze the cause and effect of a particular issue or problem. The fish’s head represents the issues, while its primary bone emphasizes the several root reasons that have contributed to the issue. We have created a super effective fishbone diagram for you with bright color tones. To put it in a nutshell, we have added plain text boxes to add your data. It is also free to edit. Isn’t that great? Give it a try!

    Features of the template

    • 100% customizable slides and easy to download.
    • Slides are available in different nodes & colors.
    • The slides contain 16:9 and 4:3 formats.
    • Easy to change the colors quickly.
    • It is a well-crafted template with an instant download facility.
    • It is a 100% pre-designed slide.
    • This slide is compatible with Google Slide Themes.
    • The slide displays a creative diagram.
    Advertisement

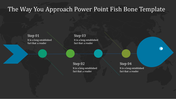
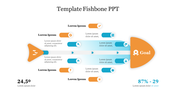
    You May Also Like These PowerPoint Templates

    Free
    Add to Wishlist
    Download
    AI Customize
    Fishbone diagram in green with four labeled sections, featuring black branching lines leading to circular markers.
    Free
    Add to Wishlist
    Download
    AI Customize
    Multicolor fishbone diagram with gradient shades of yellow, blue, orange, green, and pink, featuring labeled sections.
    Add to Wishlist
    Download
    AI Customize
    Fishbone diagram with a blue fish leading a group of fish forming a bone structure, labeled with organization and client.
    Add to Wishlist
    Download
    AI Customize
    Cause and effect PowerPoint template with four causes, colorful icons, and text placeholders.
    Add to Wishlist
    Download
    AI Customize
    Ishikawa Fishbone diagram slide with six categories for root cause analysis and text sections.
    Add to Wishlist
    Download
    AI Customize
    Visual fishbone layout illustrating a risk analysis framework with six red nodes and connecting black lines.
    Add to Wishlist
    Download
    AI Customize
    Fishbone diagram slide illustrating key business strategies plan, position, pattern, and ploy with text descriptions.
    Add to Wishlist
    Download
    AI Customize
    Fishbone diagram PowerPoint slide with 10 sections, each labeled with colorful captions for presenting key information.
    Add to Wishlist
    Download
    AI Customize
    Example Of Fishbone Presentation PowerPoint Template
    Add to Wishlist
    Download
    AI Customize
    A fishbone diagram template with four colorful branches labeled from 01 to 04, each containing placeholder text for captions.
    Free
    Add to Wishlist
    Download
    AI Customize
    Fishbone diagram with a red head and twelve labeled branches, each connected to placeholder text areas.
    Add to Wishlist
    Download
    AI Customize
    Cause-and-effect diagram showing six causes labeled 01 to 06, connected to a central blue arrow pointing right.
    Add to Wishlist
    Download
    AI Customize
    Fishbone diagram with six colorful nodes in yellow and purple tones, and captions, branching from a central gray circle.
    Free
    Add to Wishlist
    Download
    AI Customize
    Fishbone diagram with numbered sections in purple, red, and yellow, connected to a central blue head and green tail.
    Add to Wishlist
    Download
    AI Customize
    Fishbone diagram showing causes and effects, with eight orange headings and gray sub branches labeled as risks.
    Add to Wishlist
    Download
    AI Customize
    Fishbone diagram PowerPoint template with six captions, each having multiple styles for visual representation.
    Add to Wishlist
    Download
    AI Customize
    Fishbone diagram with sections in yellow, red, purple, blue, teal, and green, connected to a central gray node.