Free - Fishbone Diagram Template PowerPoint and Google Slides
Free

 Canva
Canva
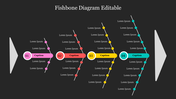
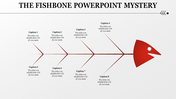

Fishbone PowerPoint Template and Google Slides
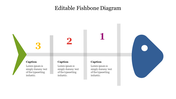
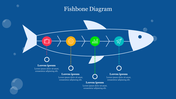
The "Fishbone PowerPoint Template and Google Slides" is a powerful tool for problem-solving and root cause analysis. In the diagram, the head of the fish represents the problem itself, while the bones represent the various causes contributing to the issue. The fish is depicted in a vibrant orange color, making it visually appealing and easy to interpret.
This template can be used by professionals across different industries, project managers, quality assurance teams, educators, or anyone involved in problem-solving processes. Whether you're investigating production inefficiencies, analyzing customer complaints, or improving organizational processes, the Fishbone PowerPoint Template and Google Slides can assist in visually mapping out the root causes of complex issues.
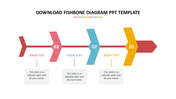
Compatibility with PowerPoint and Google Slides. Available in 16:9 and 4:3 aspect ratios, catering to different screen sizes and presentation preferences. Provided in ZIP format for easy sharing and distribution. Free template with 100% customizable features. Download now.


You May Also Like These PowerPoint Templates


Add to Wishlist
Download
Edit
 Diagram PowerPoint Template and Google Slides")
Add to Wishlist
Download
Edit

Add to Wishlist
Download
Edit

Add to Wishlist
Download
Edit


Add to Wishlist
Download
Edit

Add to Wishlist
Download
Edit

Add to Wishlist
Download
Edit


Add to Wishlist
Download
Edit


Add to Wishlist
Download
Edit

Add to Wishlist
Download
Edit

Add to Wishlist
Download
Edit

Add to Wishlist
Download
Edit


Add to Wishlist
Download
Edit

