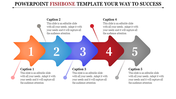
PowerPoint Fishbone Template for Process Improvement

Fishbone diagram template showing a fisherman with three colored fish in the water, each with captions.
P.ID : 22238
    924 views
    70 Downloads
    Get Custom Slides by Experts
    Instantly Access Templates in PowerPoint

    Fishbone PowerPoint Template and Google Slides Themes


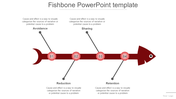
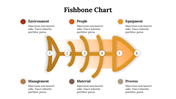
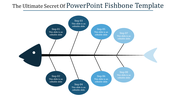
    Capture your audience's attention with our unique fishbone PowerPoint template and Google Slides design. This infographic features a lifelike depiction of a human figure sitting and fishing, symbolizing the process of identifying and solving problems. 

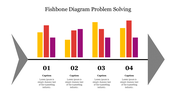
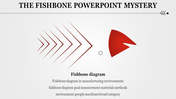
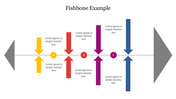
    The fishbone diagram, also known as an Ishikawa diagram, is incorporated to visually represent the causes and effects related to a particular issue. Set against a realistic backdrop, this template makes complex problem-solving processes easy to understand and engaging.

    Perfect for root cause analysis, project management, or strategic planning, this template brings your problem-solving strategies to life. Present your findings with clarity and creativity using this innovative template.

    Features of the template


    • 100% customizable slides and easy to download.
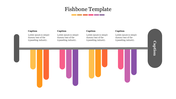
    • Slides are available in different nodes & colors.
    • The slide contains 16:9 and 4:3 formats.
    • It is easy to change the colors of the slide quickly. 
    • Well-crafted template with an instant download facility.
    Advertisement

    You May Also Like These PowerPoint Templates

    Free
    Add to Wishlist
    Download
    AI Customize
    Fishbone diagram with four yellow numbered circles along the spine, each connected to labeled branches representing causes.
    Free
    Add to Wishlist
    Download
    AI Customize
    Fishbone PowerPoint template with four steps, represented by nodes along a horizontal line, ending in a fish like shape.
    Add to Wishlist
    Download
    AI Customize
    Colorful fishbone diagram PowerPoint template with arrows leading to a goal, featuring various icons and text placeholders.
    Add to Wishlist
    Download
    AI Customize
    Fillable Fishbone Diagram showing the main cause with several branching categories, each labeled with placeholder text.
    Add to Wishlist
    Download
    AI Customize
    Fishbone diagram slide with stages like Plan, Initiation, Execution, and Control with fish illustrations on a blue theme.
    Free
    Add to Wishlist
    Download
    AI Customize
    Fishbone diagram in green with four labeled sections, featuring black branching lines leading to circular markers.
    Free
    Add to Wishlist
    Download
    AI Customize
    Multicolor fishbone diagram with gradient shades of yellow, blue, orange, green, and pink, featuring labeled sections.
    Add to Wishlist
    Download
    AI Customize
    Fishbone diagram with a blue fish leading a group of fish forming a bone structure, labeled with organization and client.
    Add to Wishlist
    Download
    AI Customize
    Ishikawa Fishbone diagram slide with six categories for root cause analysis and text sections.
    Add to Wishlist
    Download
    AI Customize
    Visual fishbone layout illustrating a risk analysis framework with six red nodes and connecting black lines.
    Add to Wishlist
    Download
    AI Customize
    Fishbone diagram slide illustrating key business strategies plan, position, pattern, and ploy with text descriptions.
    Add to Wishlist
    Download
    AI Customize
    Fishbone diagram PowerPoint slide with 10 sections, each labeled with colorful captions for presenting key information.
    Add to Wishlist
    Download
    AI Customize
    Example Of Fishbone Presentation PowerPoint Template
    Add to Wishlist
    Download
    AI Customize
    A fishbone diagram template with four colorful branches labeled from 01 to 04, each containing placeholder text for captions.
    Free
    Add to Wishlist
    Download
    AI Customize
    Fishbone diagram with a red head and twelve labeled branches, each connected to placeholder text areas.
    Add to Wishlist
    Download
    AI Customize
    Cause-and-effect diagram showing six causes labeled 01 to 06, connected to a central blue arrow pointing right.