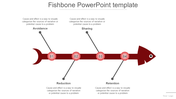
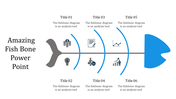
Free - Imaginative FishBone PowerPoint Presentation with Four Nodes

 Canva
Canva
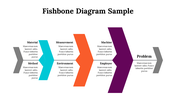
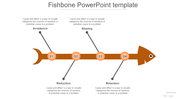
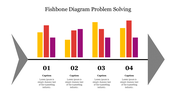
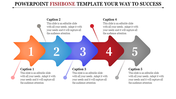
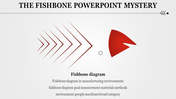
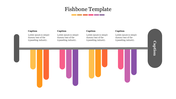
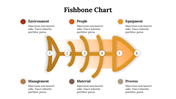
Dynamic Fishbone Diagram PowerPoint Templates
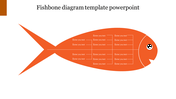
Embark on a problem-solving expedition using our Fishbone Diagram PowerPoint Presentation. These templates are your key to unraveling cause-and-effect intricacies, guiding users of all ages through interconnected factors that influence an issue. Offering an array of visually stimulating slides, these professional templates simplify complexities, employing Fishbone, Ishikawa, or Cause-and-Effect diagrams, fostering strategic thinking for business insights. Illuminate your presentations with these dynamic tools, allowing a comprehensive exploration of problem roots and their implications. Seamlessly navigate through complexities and articulate robust solutions, both online and offline, with these versatile diagrams—a journey towards effective and seamless problem-solving.
Features of this template:
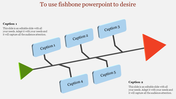
- 100% customizable slides and easy to download.
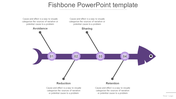
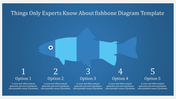
- Slides available in different nodes & colors.
- The slide contained 16:9 and 4:3 format.
- Easy to change the slide colors quickly.
- Well-crafted template with instant download facility.


You May Also Like These PowerPoint Templates


