Editable Fishbone Diagram Template PPT for Custom Use

Fishbone PowerPoint Template and Google Slides
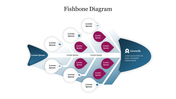
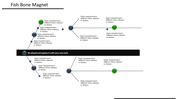
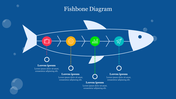
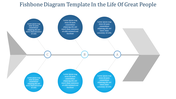
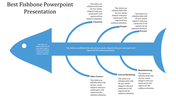
The "Fishbone PowerPoint Template and Google Slides" is a visual tool designed to facilitate the analysis of complex problems by identifying their root causes. The image features a fishbone diagram template, also known as a cause-and-effect diagram or Ishikawa diagram. This diagram is shaped like a fish skeleton, with the head of the fish representing the problem or effect, and the bones extending from it representing the various potential causes.
This template can be utilized by individuals and teams across various industries and disciplines to dissect and understand the underlying factors contributing to a particular issue or challenge. Whether in business, healthcare, manufacturing, education, or any other field, the fishbone diagram is an effective method for problem-solving and decision-making.
Compatibility with PowerPoint and Google Slides. Available in 16:9 and 4:3 aspect ratios, catering to different screen sizes and presentation preferences. Provided in ZIP format for easy sharing and distribution. 100% customizable features. Download now.


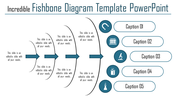
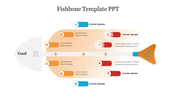
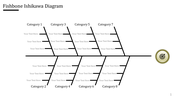
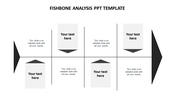
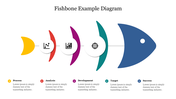
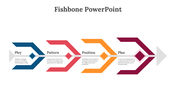
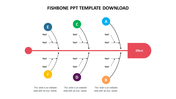
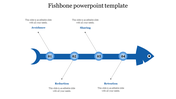
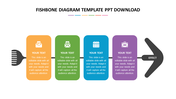
You May Also Like These PowerPoint Templates

Add to Wishlist
Download
Edit


Add to Wishlist
Download
Edit

Add to Wishlist
Download
Edit

Add to Wishlist
Download
Edit

Add to Wishlist
Download
Edit


Add to Wishlist
Download
Edit

Add to Wishlist
Download
Edit

Add to Wishlist
Download
Edit

Add to Wishlist
Download
Edit

Add to Wishlist
Download
Edit

Add to Wishlist
Download
Edit

Add to Wishlist
Download
Edit


Free
Add to Wishlist
Download
Edit


