Dashboard Slide PowerPoint Template and Google Themes

Dashboard slide with three gray semicircle gauges and captions below, set against a black gradient background.
P.ID : 17082
    207 views
    6 Downloads
    Get Custom Slides by Experts
    Instantly Access Templates in PowerPoint

    Editable Dashboard PowerPoint Template


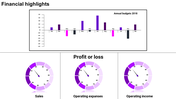
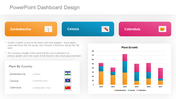
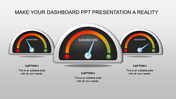
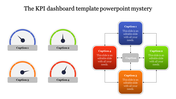
    Welcome to the world of Dashboard PowerPoint Template. Look in the middle—a slide that makes the difference between simple numbers and compelling insights. Our designs feature three stylish dashboard meters, neatly arranged on the canvas. Every meter is an empty canvas, waiting for your data to breathe life into it. Whether it’s sales figures, project milestones, or survey results, these meters adapt to better match your story. Caption 1: Customize this meter to show your revenue growth.

    As your profit increases, the product dances, wowing your audience. Caption 2: Herein lies the heartbeat of your project’s progress. Modify to reflect completion percentage, completion time, or points won. Caption 3: Pulse with positive feedback scores of customer satisfaction or dip and areas for improvement. Executive: Raise your boardroom presentation. Influence stakeholders, test deals, and make nuanced data-driven decisions. Ready to make changes to your presentation? Click below to find Templates and Google Slides Themes.

    Features of the template:

    •  Slides are available in 4:3 & 16:9
    • Well-crafted template with instant download.
    • Get slides that are 100% customizable and easy to download
    Advertisement

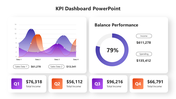
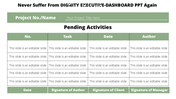
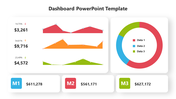
    You May Also Like These PowerPoint Templates

    Free
    Add to Wishlist
    Download
    AI Customize
    Slide featuring a bar graph and line chart showing monthly money transactions, alongside silhouettes of people shaking hands.
    Add to Wishlist
    Download
    AI Customize
    Executive dashboard table featuring numbered rows, with text, and red column headers for clarity.
    Free
    Add to Wishlist
    Download
    AI Customize
    PowerPoint template featuring a colorful dashboard with bar graphs, pie charts, progress rings, and a timeline for data.
    Add to Wishlist
    Download
    AI Customize
    Dashboard showing expense meters, global percentages on a map, and a bar chart visualizing data distribution.
    Add to Wishlist
    Download
    AI Customize
    Slide deck with KPI charts and graphs for business analysis, including financials, HR performance, and customer service.
    Add to Wishlist
    Download
    AI Customize
    KPI dashboard template with a line chart, progress indicators, and bar graphs showing different performance metrics.
    Free
    Add to Wishlist
    Download
    AI Customize
    Dashboard layout includes a line graph, pie chart, and three bar graphs, all colored in red, green, and blue.
    Free
    Add to Wishlist
    Download
    AI Customize
    Project dashboard slide for electricity data with bar graphs showing units and amounts for different categories and months.
    Add to Wishlist
    Download
    AI Customize
    KPI dashboard template with progress bars, pie chart, bar graphs, and workload metrics in a clean blue theme.
    Add to Wishlist
    Download
    AI Customize
    Dashboard slide showing business performance, including technology, accessibility, and security scores with activity graphs.
    Add to Wishlist
    Download
    AI Customize
    KPI dashboard slide featuring six charts vertical bars, horizontal bars, area graph, pie chart, and column bar graphs.
    Add to Wishlist
    Download
    AI Customize
    KPI dashboard highlighting supplier statistics using donut charts, order-to-invoice process, and bar charts.
    Free
    Add to Wishlist
    Download
    AI Customize
    Dashboard with four sections showing charts, icons, and metrics in purple, red, green, and teal.
    Free
    Add to Wishlist
    Download
    AI Customize
    A slide with a sleek dashboard design that includes colorful data visualizations like pie charts, graphs, and progress bars.
    Free
    Add to Wishlist
    Download
    AI Customize
    KPI dashboard with percentage stats, bar charts, and flow diagrams in red, blue, and orange representing data trends.
    Add to Wishlist
    Download
    AI Customize
    KPI dashboard slide displaying supplier metrics with colorful pie charts, bar graphs, and a process flow with percentages.