Dashboard Slide Template Presentation

Dashboard PPT slide with three red speedometers representing metrics or performance indicators with captions.
P.ID : 17078
    210 views
    6 Downloads
    Get Custom Slides by Experts
    Instantly Access Templates in PowerPoint

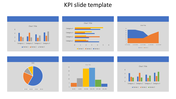
    Dynamic Dashboard PowerPoint Template Presentation: Release Data Power


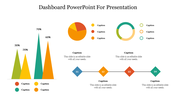
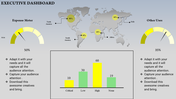
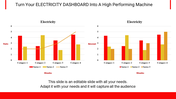
    Revolutionize your presentations with our cutting-edge Dashboard PowerPoint Template Presentation. Seamlessly designed with three interactive nodes, each featuring a caption, title holder, and text area, this template empowers you to convey complex data with clarity and style.

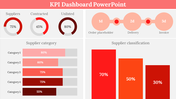
    Crafted for professionals across industries, from analysts to executives, this template transforms mundane presentations into engaging narratives. Whether you're showcasing financial reports, project updates, or sales forecasts, our Dashboard Template ensures your message resonates.

    With a sleek design and intuitive interface, navigating through your data has never been easier. Say goodbye to cluttered slides and hello to impactful presentations that captivate your audience's attention.

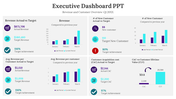
    Improve your presentations and make an unforgettable impression with our Dashboard PowerPoint Template Presentation. Experience the difference today!

    Features of the Template


    • 100 % customizable slides.
    • The slide show is in 4:3, 16:9, zip format.
    • There is powerful connectivity with Google Slides and PowerPoint.
    • It is simple and quick to alter the slide's color.
    • An efficient template that can be easily accessed immediately.
    • Well-crafted template with an instant download facility.
    Advertisement

    You May Also Like These PowerPoint Templates

    Free
    Add to Wishlist
    Download
    AI Customize
    A slide with a sleek dashboard design that includes colorful data visualizations like pie charts, graphs, and progress bars.
    Free
    Add to Wishlist
    Download
    AI Customize
    KPI dashboard with percentage stats, bar charts, and flow diagrams in red, blue, and orange representing data trends.
    Add to Wishlist
    Download
    AI Customize
    KPI dashboard slide displaying supplier metrics with colorful pie charts, bar graphs, and a process flow with percentages.
    Free
    Add to Wishlist
    Download
    AI Customize
    KPI slide displaying three circular meters with red, green, and orange sections, with text descriptions on the right.
    Free
    Add to Wishlist
    Download
    AI Customize
     KPI dashboard featuring colorful graphs, sales metrics, real estate charts, and visitor statistics, in a grid layout.
    Free
    Add to Wishlist
    Download
    AI Customize
    Slide with multiple dashboard elements including bar charts, line charts, pie charts, and progress meters in various colors.
    Free
    Add to Wishlist
    Download
    AI Customize
    KPI PowerPoint slide with line, bar, pie, and horizontal bar charts, each showing different business data metrics.
    Add to Wishlist
    Download
    AI Customize
    Executive summary dashboard featuring contract metrics, costs vs. revenue, and breakdowns by status, industry, and category.
    Free
    Add to Wishlist
    Download
    AI Customize
    Free Dashboard Templates For PowerPoint & Google Slides
    Add to Wishlist
    Download
    AI Customize
    Dashboard slide displaying data through colorful bar charts, a pie chart, and a project timeline with phase completions.
    Free
    Add to Wishlist
    Download
    AI Customize
    Semi circular speedometer graphic with red to yellow gradient, and three placeholder text below.
    Add to Wishlist
    Download
    AI Customize
    RAG status slide with a task table featuring colored status indicators and four charts, including pie and line graphs.
    Add to Wishlist
    Download
    AI Customize
    Comprehensive KPI dashboard slide with performance indicators visualized through charts and graphs for business tracking.
    Free
    Add to Wishlist
    Download
    AI Customize
    KPI dashboard slide showcasing various business metrics through colorful bar charts, pie charts, and a gauge meter.
    Add to Wishlist
    Download
    AI Customize
    KPI format slide displaying financial performance metrics with detailed charts and figures.
    Free
    Add to Wishlist
    Download
    AI Customize
     Sales Dashboard PPT Template & Google Slide Themes
    Add to Wishlist
    Download
    AI Customize
    Three speedometer charts slide with captions indicating different data points, highlighted in green, yellow, and orange.
    Free
    Add to Wishlist
    Download
    AI Customize
    Free Dashboard PowerPoint Template Design template