Detailed Dashboard PPT Template for Performance Tracking

Dashboard slide featuring various charts, including a pie chart, bar chart, line graph, and column chart with text.
P.ID : 17304
    168 views
    5 Downloads
    Get Custom Slides by Experts
    Instantly Access Templates in PowerPoint

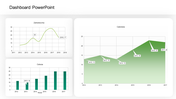
    Introducing the Gray Theme Dashboard PowerPoint Template


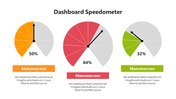
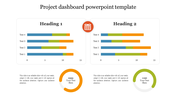
    In the realm of business, a dashboard serves as a pivotal tool for visualizing and analyzing data in a concise and user-friendly manner. It offers a centralized platform where key metrics and performance indicators are prominently displayed, empowering users to monitor trends, track progress, and make informed decisions efficiently.

    About the Slide

    The Gray Theme Dashboard PowerPoint template is designed to streamline the visualization and analysis of complex data. It offers editable slides that can be tailored to meet specific presentation needs, enhancing flexibility and functionality.

    Benefits of the Slide

    This dashboard template enables users to create informative presentations that captivate audiences and convey insights quickly. Its customizable features ensure design consistency and polished delivery of information.

    Who Can Use

    Ideal for business professionals, project managers, educators, and anyone needing to visualize and communicate data-driven insights effectively.

    Experience the power of our Gray Theme Dashboard template to elevate your presentations and inspire action. Download now!


    Features of the template:


    • 100% customizable slides and easy to download.
    • The slides contain 16:9 and 4:3 formats.
    • Easy to change the colors quickly.
    • It is a 100% pre-designed slide.
    Advertisement

    You May Also Like These PowerPoint Templates

    Add to Wishlist
    Download
    AI Customize
    Infographic featuring two red semicircular speedometers with needles, displaying percentages, and captions below.
    Add to Wishlist
    Download
    AI Customize
    Purple themed dashboard slide featuring multiple charts and a text box for descriptive content.
    Add to Wishlist
    Download
    AI Customize
    Dashboard slide with three blue icons and captions paired with a bar chart on a tablet screen, and a desk setup on the right.
    Add to Wishlist
    Download
    AI Customize
    Yellow speedometer graphic indicating 70%, with a gray needle pointing right and a caption area below.
    Add to Wishlist
    Download
    AI Customize
    Black circular speedometer gauge with a green needle, surrounded by six captions on a white background.
    Free
    Add to Wishlist
    Download
    AI Customize
    Circular speedometer infographic with a black needle, yellow progress arc, and distance markers, next to an text box.
    Add to Wishlist
    Download
    AI Customize
    Sales performance dashboard PowerPoint template with a line graph, pie chart, and percentage change analysis.
    Add to Wishlist
    Download
    AI Customize
    Chart design slide tracking article likes, comments, shares, total posts, and new subscriber growth with visual graphs.
    Add to Wishlist
    Download
    AI Customize
    Speedometer PowerPoint template with yellow background showing a 70 percent reading, along with 50 and 60 percent gauges.
    Add to Wishlist
    Download
    AI Customize
    Executive dashboard featuring a bar chart of project tasks, pie chart for project distribution, and a line graph.
    Free
    Add to Wishlist
    Download
    AI Customize
    Speedometer graphic with a blue progress bar, labeled distance values, and a right-side text box explaining its concept.
    Add to Wishlist
    Download
    AI Customize
    Chart PPT template with bar graphs showing clicks and recipients, a pie chart for email categories, and a line graph.
    Add to Wishlist
    Download
    AI Customize
    Dashboard layout with horizontal bar charts and circular progress indicators in green, yellow, orange, and blue.
    Add to Wishlist
    Download
    AI Customize
    Amazing PowerPoint Dashboard Presentation Template
    Add to Wishlist
    Download
    AI Customize
    Circular tachometer gauge with a needle pointing six colored sections, and captions in rounded rectangles connected by lines.
    Free
    Add to Wishlist
    Download
    AI Customize
    Circular gauge style infographic in shades of gray, showing a speedometer with a needle and distance markers.
    Add to Wishlist
    Download
    AI Customize
    Business executive dashboard template displaying project information, including date and editor with placeholder text.