Innovative Cause And Effect PPT Presentation Slide

Cause and effect PowerPoint slide with three rows of paired text boxes and icons in orange, blue, and red colors.
P.ID : 49305
    671 views
    43 Downloads
    Get Custom Slides by Experts
    Instantly Access Templates in PowerPoint

    Most useful Cause And Effect PPT Template

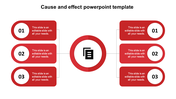
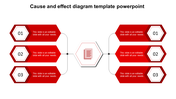
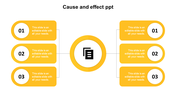
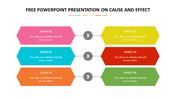
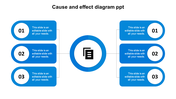
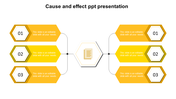
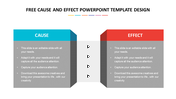
    A cause and effect study helps you brainstorm all the potential causes of the problem. A diagram-based tool will answer the question, Why does this happen? And examine the possible causes of the problem. It also expands your ability to diagnose and find the root cause. Get our Cause And Effect PPT Presentation Slide if you want to solve a highly complex problem. We provide three icons and six text areas with different shades to separately include your cause and effect report.

    Features of the template

    • 100% Customizable (shape color, size & text)
    • Drag and drop image placeholder
    • Pack of best slides to impress your audience
    • This slide supports the 16:9 and 4:3 formats
    • Easy to change the slide colors
    • You can use it in Google Slides and Microsoft PowerPoint.
    • It is a well-crafted PPT with an instant download facility.
    Advertisement

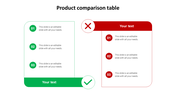
    You May Also Like These PowerPoint Templates

    Add to Wishlist
    Download
    AI Customize
    Change PPT template with before and after sections, showcasing content areas with color coded arrows and icons.
    Add to Wishlist
    Download
    AI Customize
    Corporate PPT slide with headings and captions, displaying icons and checkmarks alongside silhouettes of businesspeople.
    Free
    Add to Wishlist
    Download
    AI Customize
    Get Free PowerPoint Cause And Effect Download Template
    Free
    Add to Wishlist
    Download
    AI Customize
    Ishikawa diagram in grayscale, shaped like a fish with arrows pointing from three causes to three effects.
    Free
    Add to Wishlist
    Download
    AI Customize
    Blue cause and effect PowerPoint slide with numbered sections and directional arrows with placeholder text.
    Free
    Add to Wishlist
    Download
    AI Customize
    A professional comparison slide featuring horizontal bar graphs displaying various percentages alongside captions with icons.
    Free
    Add to Wishlist
    Download
    AI Customize
    Comparison slide showing a 45 male and 58 female percentages distribution with arrows pointing towards each gender.
    Add to Wishlist
    Download
    AI Customize
    Creative Cause Effect Diagram PPT And Google Slides
    Add to Wishlist
    Download
    AI Customize
    Two overlapping circles comparing Phone X and Phone Y, with text boxes outlining key features listed on either side.
    Free
    Add to Wishlist
    Download
    AI Customize
    A Root Cause Analysis slide with icons and branches in three colors for identifying causes and their effect with a title.
    Free
    Add to Wishlist
    Download
    AI Customize
    The slide shows a product comparison between two phones highlighting their features and an icon in circular frame at center.
    Add to Wishlist
    Download
    AI Customize
    Pricing tiers comparison slide showing four colored plans with corresponding prices and subscription duration with text area.
    Add to Wishlist
    Download
    AI Customize
    Comparison chart with male in blue and female in pink, showing data columns labeled A to J in white bars.
    Add to Wishlist
    Download
    AI Customize
    Chart explaining the relationship between cause as the starting point and effect as the ongoing outcome.
    Add to Wishlist
    Download
    AI Customize
    RCA slide showing a fishbone layout with blue, green, and red sections leading into a gray element.
    Add to Wishlist
    Download
    AI Customize
    Cause and effect slide with six caption sections for adding text, connected to a central loop with icons.