Best Cause And Effect Diagrams PowerPoint And Google Slides

Pack of 12 slides
P.ID : 69498
Advertisement
411 views
43 Downloads
Get Custom Slides by Experts
Instantly Access Templates in PowerPoint

Practical Cause And Effect Diagrams Template With Six Nodes

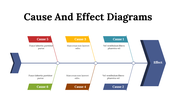
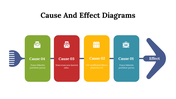
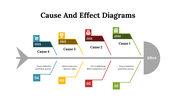
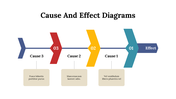
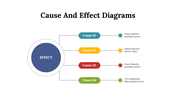
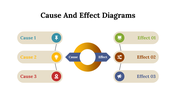
Are you looking for a way to illustrate cause-and-effect relationships in your presentations? Look no further than the Cause and Effect Diagrams Template. This user-friendly template contains a collection of high-quality design and text areas that can help you effectively visualize and analyze cause-and-effect relationships. Also, it includes visually appealing visuals and diagrams like fishbone diagrams, titleholders, and many more. In addition, all of these diagrams are fully editable, allowing you to easily tailor them to your specific needs. This template also comes with an extensive set of six text areas and shapes that can help you quickly add emphasis to your points.

Features of the Template

  • 100% customizable slides and easy-to-download
  • Slides are available in different nodes & colors.
  • This PowerPoint has a fishbone theme. 
  • The slides contain 16:9 and 4:3 formats.
  • It comes with six nodes.
  • Easy to change the slide colors quickly.
  • It is a well-crafted template with an instant download facility.
  • We designed this slide with a stunning design.
  • You can use this in Google Slides and Microsoft PowerPoint.

You May Also Like These PowerPoint Templates

Add to Wishlist
Download
AI Customize
Slide with a light bulb icon in the center and five numbered circular sections in various colors, connected by dotted lines.
Add to Wishlist
Download
AI Customize
Four horizontal bars with multicolored headers, each separated by a central number and captions aligned in the layout.
Add to Wishlist
Download
AI Customize
Comparison diagram showing the connection between logistics 4.0 and industry 4.0, with shared elements in the center.
Add to Wishlist
Download
AI Customize
Two hexagonal icons representing limitations and challenges, each with descriptive text below in a white background.
Free
Add to Wishlist
Download
AI Customize
A split layout with green and white, each displaying a bar chart, with icons and text below.
Add to Wishlist
Download
AI Customize
Pricing comparison table with four columns for silver, gold, diamond, and platinum plans, each showing a monthly price.
Add to Wishlist
Download
AI Customize
Two-column comparison template for Phone X and Phone Y with key features like display resolution and battery capacity.
Add to Wishlist
Download
AI Customize
Comparison layout featuring green and red semi circles with percentages, separated by a blue vs icon in the middle.
Add to Wishlist
Download
AI Customize
Pyramid comparison chart with social media icons LinkedIn, Google Plus, Twitter, Facebook and text captions below.
Add to Wishlist
Download
AI Customize
Comparison slide with two circular groups labeled Team 1 and Team 2, surrounded by red and pink human icons.
Add to Wishlist
Download
AI Customize
Comparison PPT slide featuring colorful icons of people with different percentages, illustrating a gender based comparison.
Add to Wishlist
Download
AI Customize
Two phones compared side by side with red circular icons with text boxes, around a central circle of balance grphic.
Add to Wishlist
Download
AI Customize
Difference Between Sales Funnel And Sales Pipeline PPT
Add to Wishlist
Download
AI Customize
Business pros and cons comparison slide with key factors and icons with placeholder text.
Add to Wishlist
Download
AI Customize
Comparison diagram of manufacturing and logistics, with icons representing production, storage, and transportation.
Add to Wishlist
Download
AI Customize
Two columns with blocks in teal, red,  blue, and orange, illustrating 
differences between compliance and security concepts.
Add to Wishlist
Download
AI Customize
Product comparison slide comparing Phone X and Y on display, processor, and camera features in a yellow themed layout.
Add to Wishlist
Download
AI Customize
Bar chart with gray and red bars, comparing two gender icons in blue and green, with caption on the right.
Add to Wishlist
Download
AI Customize
A PowerPoint slide comparing two IT services managed services and vDoctor, with key features and benefits highlighted.
Add to Wishlist
Download
AI Customize
A comparison slide featuring two animated characters representing Companies 1 and 2 with their respective product lists.
Add to Wishlist
Download
AI Customize
Comparison slide with three set of bar charts in red and yellow, displaying numbers, and text on a gradient background below.
Add to Wishlist
Download
AI Customize
Product PowerPoint slide showing five steps in product evaluation with yellow icons for each stage.
Add to Wishlist
Download
AI Customize
Comparison PowerPoint template with male and female icons and text captions for detailed data presentation.
Add to Wishlist
Download
AI Customize
Two-column comparison slide with decorative paths and caption areas for left and right sides maze like structures.
Add to Wishlist
Download
AI Customize
Timeline diagram showing four blue arrows numbered 01 to 04 along a central gray line placed in white background.
Add to Wishlist
Download
AI Customize
Colorful table with generational categories and year ranges, paired with illustrations of people, on a light background.