Cause And Effect PPT Template Free Design Presentation

Structured layout featuring four rows of paired colored circles and corresponding gray text boxes on a white background.
P.ID : 43718
    11 slides
    Leadership Vs Management PPT Template and Google Slides
    11 slides
    Internal vs external audit slide with red and teal sections for the characteristic differences between both audit types.
    11 slides
    Android mobile vs. Apple mobile slides featuring logos of both platforms in different layout designs and icons with text.
    21 slides
    Comparison slide deck featuring different visual formats like arrows, charts, and hexagons to compare two products.
    11 slides
    Best Fixed Vs Growth Mindset PPT And Google Slides Templates
    977 views
    74 Downloads
    Get Custom Slides by Experts
    Instantly Access Templates in PowerPoint

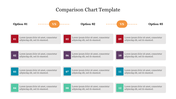
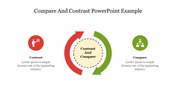
    Enticing Cause And Effect Presentation

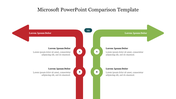
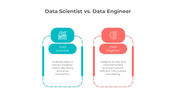
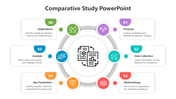
    Using our Cause And Effect Diagram, you can get rid of your debts. It will give your ideas more excellent credit. Also, You can use four rectangles connected with multicolor circles on each side to visually represent the causative parts, their interconnections, and their influence. Download these editable cause and effect ppt slides to develop displays on root cause analysis, business analogy, or business situations. These templates are consistent with Google Slides and PPT. Browse our free ppt templates to create magnetic displays.

    Features of this Template 

    • 100 % customizable slides and easy to download.
    • Slides are available in different colors.
    • The SlideSlide has 4:3 and 16:9 formats.
    • Easy to change the slide colors quickly.
    • Appealing Presentation to impress an audience.
    • Create feature-rich slide presentations. 
    • An eye-pleasing color slide helps to give a catchy presentation. Crisp and clear font styles and design Presentation.
    • Consistent with Microsoft PPT and Google Slides.
    • Attractive multicolor display.
    Advertisement

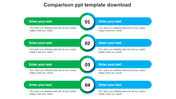
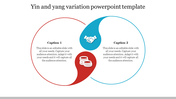
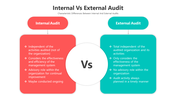
    You May Also Like These PowerPoint Templates

    Add to Wishlist
    Download
    AI Customize
    Comparison slide featuring red and blue hexagons on either side, with seven numbered nodes connected by lines.
    Add to Wishlist
    Download
    AI Customize
    Force Field Analysis PowerPoint Presentation Diagram
    Add to Wishlist
    Download
    AI Customize
    Comparison slide showing a bar chart with Generation X and Generation Z percentages, along with illustrated characters.
    Add to Wishlist
    Download
    AI Customize
    Gender symbols chart slide with two sections displaying groups of male and female icons, each with percentage markers.
    Free
    Add to Wishlist
    Download
    AI Customize
    Top Notch Comparison Bar Graph PowerPoint Presentation
    Add to Wishlist
    Download
    AI Customize
    A slide showing two gauge meters, one labeled good in green and the other bad in red, indicating performance levels.
    Add to Wishlist
    Download
    AI Customize
    Table comparing GSM and CDMA technologies with key differences on a blue background.
    Add to Wishlist
    Download
    AI Customize
    Comparison layout with orange and red header boxes labeled with online and normal shopping, separated by a blue Vs circle.
    Add to Wishlist
    Download
    AI Customize
    Comparison slide with an orange and red vertical bar featuring a grid with gray text boxes separated by colored headers.
    Add to Wishlist
    Download
    AI Customize
    Comparison chart slide showing the differences between a leader and a supervisor, with icons and bullet points for each role.
    Add to Wishlist
    Download
    AI Customize
    A superlative slide showing three individuals, with labels from short to shortest with placeholder text.
    Add to Wishlist
    Download
    AI Customize
    Two column competitor chart showing varying percentage comparisons with multicolored bars for each row.
    Add to Wishlist
    Download
    AI Customize
    A series of four colorful gears in yellow, red, green, and blue, each labeled with a percentage and numbered captions.
    Add to Wishlist
    Download
    AI Customize
    Two side by side images of engineers with performance, punctuality, and overtime bars in green and blue below each.
    Add to Wishlist
    Download
    AI Customize
    Two side by side rectangular boxes in red and purple, each featuring icons at the top and bullet points inside.
    Add to Wishlist
    Download
    AI Customize
    Comparison chart slide displaying various metrics with color coded bars and icons indicating performance across categories.