Best Analysis PowerPoint Template Slides In Table Model


Analysis Presentation Template
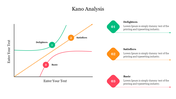
Understanding complex data and presenting it effectively is key in today’s fast-paced business environment. Our analysis PowerPoint template is designed to help U.S. professionals, students, and anyone in need of a clear and compelling way to share their insights. Our template features a horizontal bar graph labeled “Net Promoter Score – Number of Respondents.” Three categories within the graph: Detractors: 122 respondents (47%)Passives: 50 respondents (19%)Promoters: 90 respondents (34%)Net Promoter Score: -34.
Purpose of this slide:
The slide visualizes customer sentiment based on the Net Promoter Score (NPS). It helps analyze customer loyalty and satisfaction levels. Specifically useful for business analysts, marketing teams, and customer service managers.
Who can benefit?
Business professionals who need to present NPS data. Those interested in measuring brand loyalty and customer satisfaction.
Download our templates now and discover how they can help you communicate complex information effectively.
Features of the template:
- Slides are available in 4:3 & 16:9
- Get slides that are 100% customizable and easy to download
- Highly compatible with PowerPoint and Google Slides


You May Also Like These PowerPoint Templates
Add to Wishlist
Download
AI Customize

Add to Wishlist
Download
AI Customize

Add to Wishlist
Download
AI Customize

Add to Wishlist
Download
AI Customize

Add to Wishlist
Download
AI Customize

Add to Wishlist
Download
AI Customize

Add to Wishlist
Download
AI Customize

Add to Wishlist
Download
AI Customize

Add to Wishlist
Download
AI Customize

Add to Wishlist
Download
AI Customize

Add to Wishlist
Download
AI Customize

Add to Wishlist
Download
AI Customize


Free
Add to Wishlist
Download
AI Customize

Free
Add to Wishlist
Download
AI Customize

Add to Wishlist
Download
AI Customize

Free
Add to Wishlist
Download
AI Customize


