Traction Slides PowerPoint Template and Google Slides

A bar graph with ascending colored bars in yellow, green, teal, and blue, and a red rocket above, with matching text boxes.
P.ID : 48070
    666 views
    123 Downloads
    Get Custom Slides by Experts
    Instantly Access Templates in PowerPoint

    Engaging Business Traction PowerPoint Template

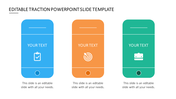
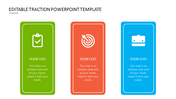
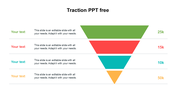
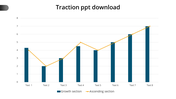
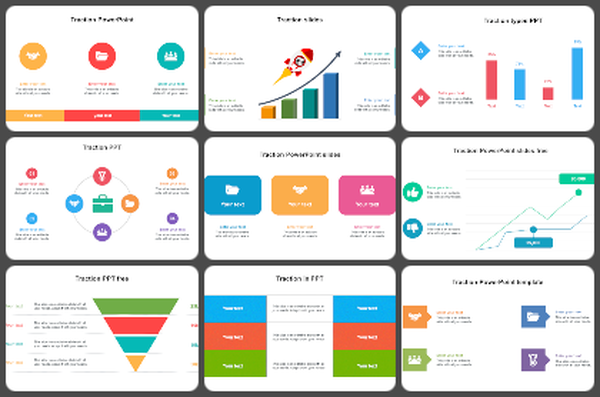
    Explaining the progress and momentum of a startup company is not so tough if you use our Traction Slide. This slide is designed with a chart and an arrow to indicate the growth. Also, the rocket animation adds fun and excitement to the audience. Add your detailed process for revenue growth in the four text areas. In addition, This PPT is used to showcase your different processes in a business meeting. You can change the fonts, the design of this template, and the borders.

    Features of the template

    • 100 % customizable slides and easy to download
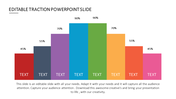
    • Slides are available in different nodes & colors.
    • This PowerPoint has four nodes.
    • The slide contained 16:9 and 4:3 formats.
    • It comes with a chart theme.
    • Easy to change the slide colors quickly.
    • It is a well-crafted template with an instant download facility.
    • It is designed with a stunning theme design.
    Advertisement

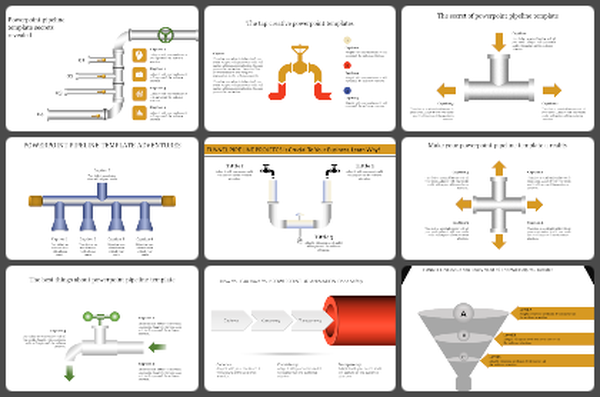
    You May Also Like These PowerPoint Templates

    Free
    Add to Wishlist
    Download
    AI Customize
    PowerPoint slide showing a line chart with data for 2018, 2019, 2020, and 2021, displaying percentages for each year.
    Add to Wishlist
    Download
    AI Customize
    A chart with three vertical bars in red, purple, and orange, with icons and descriptive text on the left.
    Free
    Add to Wishlist
    Download
    AI Customize
    Line chart showing traction growth with two labeled data points in green and blue, alongside thumbs up and thumbs down icons.
    Free
    Add to Wishlist
    Download
    AI Customize
    Traction slide with three colorful sections in green, purple, and orange, each with icons and text placeholders.
    Free
    Add to Wishlist
    Download
    AI Customize
    Slide with a four layered 3D pyramid in green, orange, blue, and yellow with matching text areas on the right.
    Add to Wishlist
    Download
    AI Customize
    Slide with a colorful area chart on the right and three numbered text sections in yellow, blue, and orange on the left.
    Add to Wishlist
    Download
    AI Customize
    Traction PowerPoint template with four colorful icons representing handshake, folder, group, and medal with placeholder text.
    Add to Wishlist
    Download
    AI Customize
    EDITABLE TRACTION POWERPOINT DESIGN TEMPLATES
    Add to Wishlist
    Download
    AI Customize
    Three rounded rectangular blocks in blue, yellow, and pink, each with an icon, aligned horizontally under a title header.
    Add to Wishlist
    Download
    AI Customize
    PowerPoint slide with a line and bar chart showing the traction across the week with a highlight and colorful text boxes.
    Add to Wishlist
    Download
    AI Customize
    Slide featuring a blue bar chart on the left and a circular progress chart showing percentage on the right.
    Add to Wishlist
    Download
    AI Customize
    Innovative Traction PowerPoint And Google Slides Template
    Free
    Add to Wishlist
    Download
    AI Customize
    Editable Traction PowerPoint Free Download Slide
    Free
    Add to Wishlist
    Download
    AI Customize
    EDITABLE TRACTION POWERPOINT TEMPLATE FREE DOWNLOAD TEMPLATES
    Add to Wishlist
    Download
    AI Customize
    Editable Traction PPT Download Slide Templates Design
    Add to Wishlist
    Download
    AI Customize
    A bar graph with ascending colored bars in yellow, green, teal, and blue, and a red rocket above, with matching text boxes.
    Add to Wishlist
    Download
    AI Customize
    Traction PPT slide with icons representing key business elements such as achievement, collaboration, and teamwork with text.
    Add to Wishlist
    Download
    AI Customize
    A segmented pie chart in yellow, red, and blue and corresponding horizontal bars on the left, each labeled with a percentage.