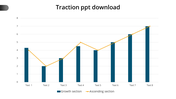
EDITABLE TRACTION POWERPOINT SLIDE TEMPLATE DIAGRAM

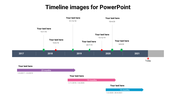

Useful Transaction Process Template
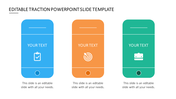
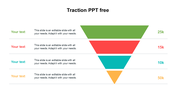
Bring out the transaction process in a business presentation with this professional template. The template is creative with three nodes that are added with a bank noes design that can make the financial presentation effective. This traction template is fully customized, so the details about your presentation. Make use of the user-friendly features and make your presentation a success.
Feature of the Template
- 100% customizable slides
- Easy to change the slide colors quickly.
- It is easy to download.
- Slides are available in different nodes & colors.
- The slide contained 16:9 and 4:3 formats.
- Well-crafted template with instant download facility.
- Creative design with text area.
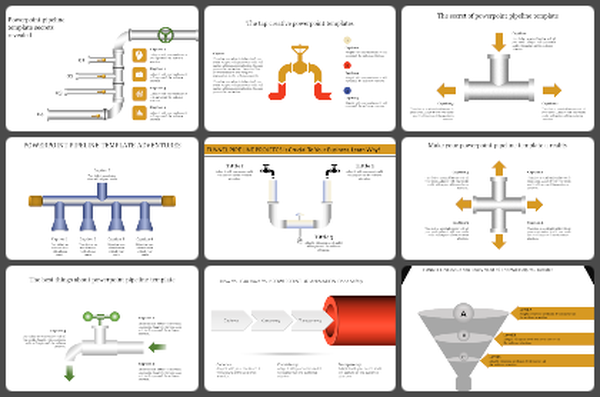


You May Also Like These PowerPoint Templates

Add to Wishlist
Download
Edit


Add to Wishlist
Download
Edit

Add to Wishlist
Download
Edit

Add to Wishlist
Download
Edit

Add to Wishlist
Download
Edit

Add to Wishlist
Download
Edit

Add to Wishlist
Download
Edit

Add to Wishlist
Download
Edit

Add to Wishlist
Download
Edit


Add to Wishlist
Download
Edit

Add to Wishlist
Download
Edit

Add to Wishlist
Download
Edit

Add to Wishlist
Download
Edit

Add to Wishlist
Download
Edit
