Simple And Editable Traction PowerPoints Download

 Canva
Canva
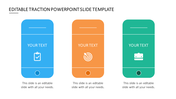
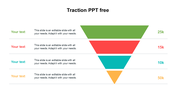
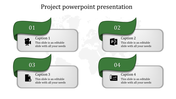

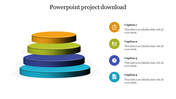
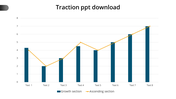
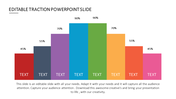
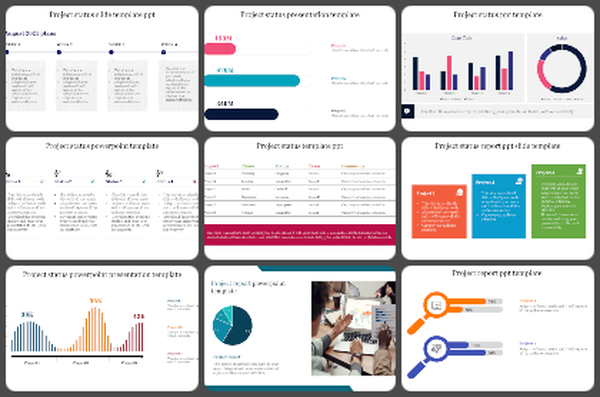
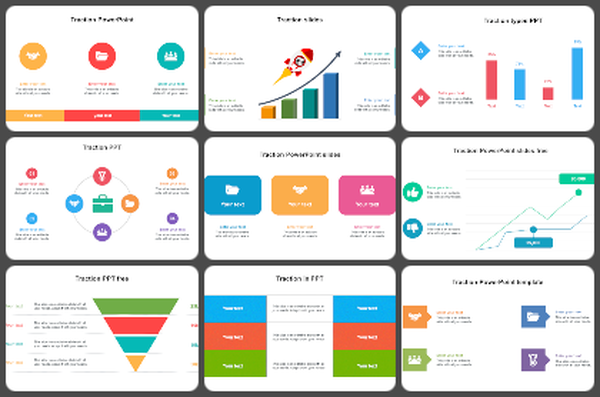
Explain With Bar Graphs And Various Diagrams
Get these extraordinary diagrams and representations inserted in a template which saves you money drastically by presenting you with high-tech slides. The five nodes are presented on the bar diagram that can be used to expand your topic vividly. The colorful bar diagram carries years and points, and the circular diagram carries percentages to make your slides informative. You can flawlessly create slides without any hindrance, so use it now.
Features of this template
- 100% customizable slides and easy to download
- Slides are available in different nodes & colors.
- The slides contained 16:9 and 4:3 formats.
- Easy to change the slide colors quickly.
- Well-crafted template with instant download facility.
- Various shapes are presented as nodes.
- Traction-themed template.
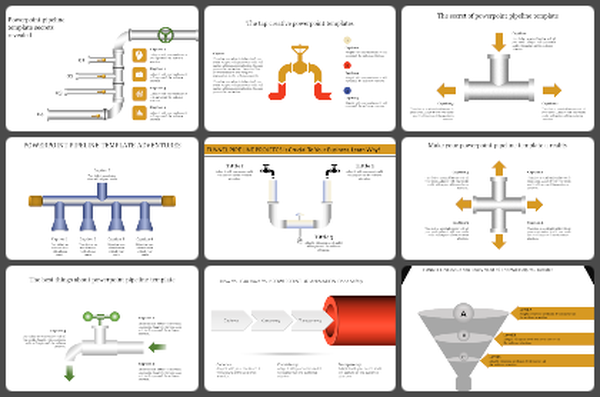

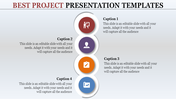
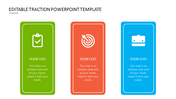
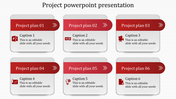
You May Also Like These PowerPoint Templates

Add to Wishlist
Download
Edit


Add to Wishlist
Download
Edit

Add to Wishlist
Download
Edit

Add to Wishlist
Download
Edit

Add to Wishlist
Download
Edit

Add to Wishlist
Download
Edit

Add to Wishlist
Download
Edit

Add to Wishlist
Download
Edit

Add to Wishlist
Download
Edit


Add to Wishlist
Download
Edit

Add to Wishlist
Download
Edit

Add to Wishlist
Download
Edit

Add to Wishlist
Download
Edit

Add to Wishlist
Download
Edit
