Free - Best Traction In PPT Presentation Slides

Free
 A traction layout with three rows and two columns, filled with blue, red, and green text boxes.
P.ID : 48075
    153 views
    26 Downloads
    Get Custom Slides by Experts
    Instantly Access Templates in PowerPoint

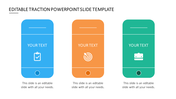
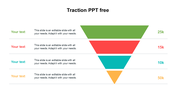
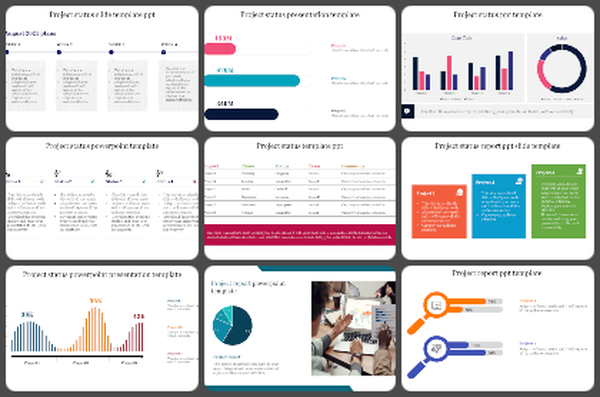
    Attractive Traction Presentation

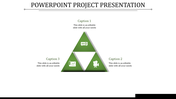
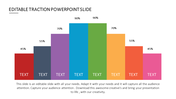
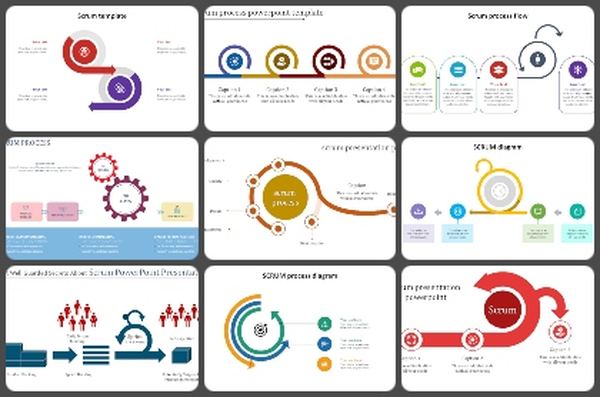
    The traction slide is a great spot to demonstrate what you are measuring and why. Always consider which metrics need to be better to advance your business. Investors will see from this three-row, multicolor table-free PPT that not only are you capable of carrying out your plan, but you can also do so while saving a tonne of cash and time. It will help your presentation advance, and it's free! Easy editing and customization are a bonus for you. Grab this editable Slide now, make the required adjustments, and finish. 

    Features of the template

    • 100 % customizable slides and easy to download.
    • Slides are available in different nodes & colors.
    • The Slide contained 16:9 and 4:3 formats.
    • Easy to change the slide colors quickly.
    • It is a well-crafted template with an instant download facility.
    • It is designed with a stunning theme design.
    • Best template for Tracktion presentations.
    Advertisement

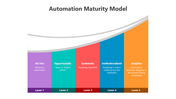
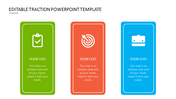
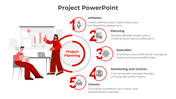
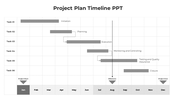
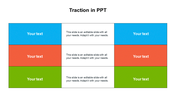
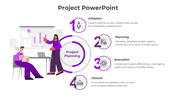
    You May Also Like These PowerPoint Templates

    Free
    Add to Wishlist
    Download
    AI Customize
    PowerPoint slide showing a line chart with data for 2018, 2019, 2020, and 2021, displaying percentages for each year.
    Add to Wishlist
    Download
    AI Customize
    A chart with three vertical bars in red, purple, and orange, with icons and descriptive text on the left.
    Free
    Add to Wishlist
    Download
    AI Customize
    Line chart showing traction growth with two labeled data points in green and blue, alongside thumbs up and thumbs down icons.
    Free
    Add to Wishlist
    Download
    AI Customize
    Traction slide with three colorful sections in green, purple, and orange, each with icons and text placeholders.
    Free
    Add to Wishlist
    Download
    AI Customize
    Slide with a four layered 3D pyramid in green, orange, blue, and yellow with matching text areas on the right.
    Add to Wishlist
    Download
    AI Customize
    Slide with a colorful area chart on the right and three numbered text sections in yellow, blue, and orange on the left.
    Add to Wishlist
    Download
    AI Customize
    Traction PowerPoint template with four colorful icons representing handshake, folder, group, and medal with placeholder text.
    Add to Wishlist
    Download
    AI Customize
    EDITABLE TRACTION POWERPOINT DESIGN TEMPLATES
    Add to Wishlist
    Download
    AI Customize
    Three rounded rectangular blocks in blue, yellow, and pink, each with an icon, aligned horizontally under a title header.
    Add to Wishlist
    Download
    AI Customize
    PowerPoint slide with a line and bar chart showing the traction across the week with a highlight and colorful text boxes.
    Add to Wishlist
    Download
    AI Customize
    Slide featuring a blue bar chart on the left and a circular progress chart showing percentage on the right.
    Add to Wishlist
    Download
    AI Customize
    Innovative Traction PowerPoint And Google Slides Template
    Free
    Add to Wishlist
    Download
    AI Customize
    Editable Traction PowerPoint Free Download Slide
    Free
    Add to Wishlist
    Download
    AI Customize
    EDITABLE TRACTION POWERPOINT TEMPLATE FREE DOWNLOAD TEMPLATES
    Add to Wishlist
    Download
    AI Customize
    Editable Traction PPT Download Slide Templates Design
    Add to Wishlist
    Download
    AI Customize
    A bar graph with ascending colored bars in yellow, green, teal, and blue, and a red rocket above, with matching text boxes.
    Add to Wishlist
    Download
    AI Customize
    Traction PPT slide with icons representing key business elements such as achievement, collaboration, and teamwork with text.
    Add to Wishlist
    Download
    AI Customize
    A segmented pie chart in yellow, red, and blue and corresponding horizontal bars on the left, each labeled with a percentage.