Free - Three Noded Technology PowerPoint Template for Presentations
 Canva
Canva











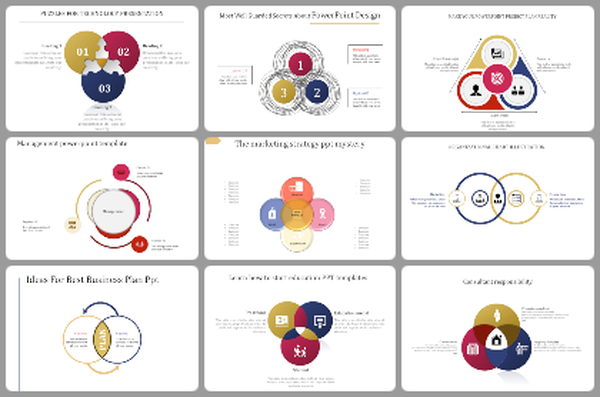
Explain Where Three Technology Factors Meet
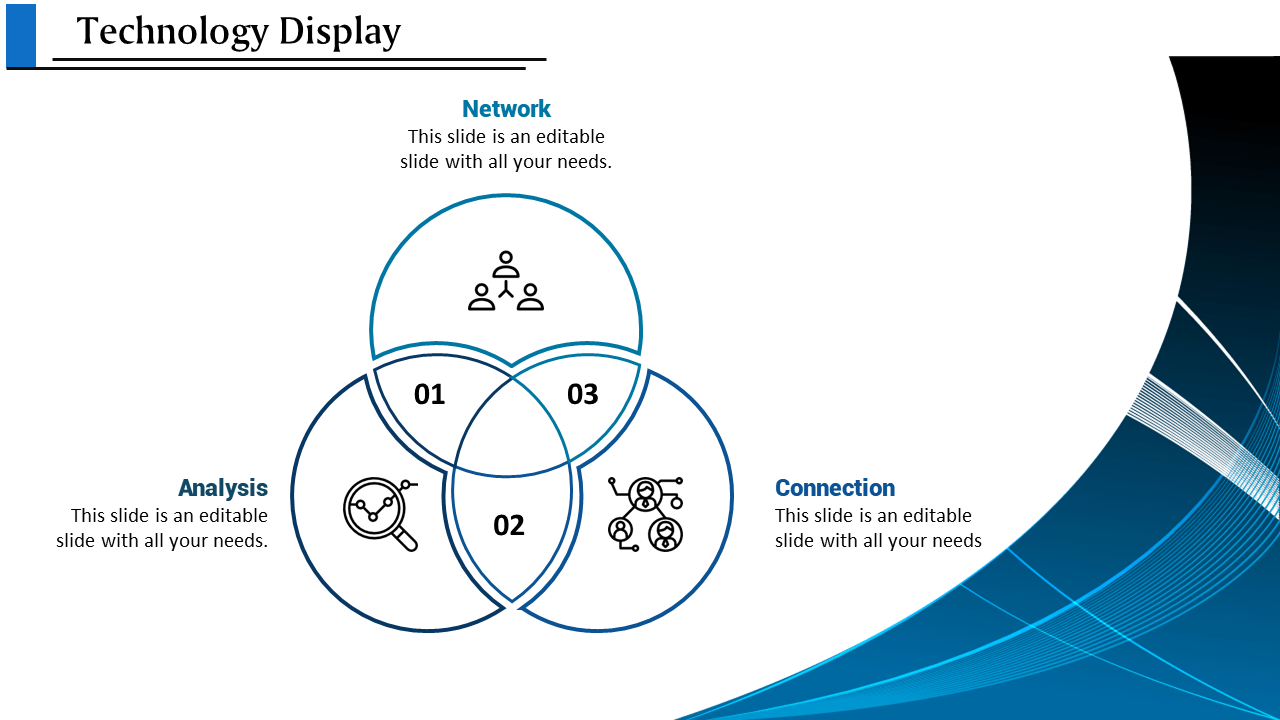
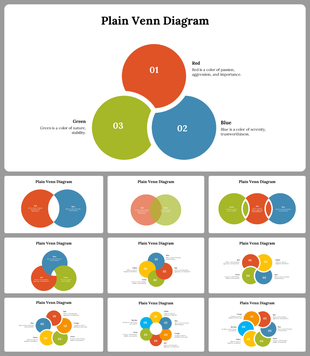
This free technology PowerPoint slide uses three overlapping circles to examine the relationship between Network, Analysis, and Connection. Each subject has its own outer area, while three numbered intersections provide space to explain what happens when two factors work together.
The design is more useful for showing relationships than for presenting a three-step sequence. An audience should be able to understand:
What each individual factor contributes
Where two factors share a function or responsibility
What becomes possible when all three are considered together
Which gaps remain when one factor is missing
Turn the Overlaps Into Meaningful Insights
Do not place three general definitions in the circles and leave the intersections unexplained. The value of a Venn diagram comes from showing how its subjects affect one another.
If you retain the existing labels, the content could follow this logic:
Network: Systems, platforms and communication infrastructure
Analysis: Data collection, interpretation and decision support
Connection: Integration between users, devices or services
Network + Analysis: Monitoring performance across connected systems
Analysis + Connection: Using shared data to improve coordination
Network + Connection: Enabling information to move between platforms
Central overlap: An integrated environment where systems, data and users work together
You can also replace the original topics with people, process and technology. In that version, use the centre for the shared outcome—such as successful digital transformation—rather than introducing a fourth unrelated idea.
Use the Diagram Only When the Subjects Truly Overlap
A Venn diagram is not the right choice when the three points simply occur in order. Use it when the audience needs to compare membership, shared responsibilities, combined capabilities or dependencies.
Keep the outer-circle descriptions brief and reserve the overlap regions for the most important relationships. The numbered labels 01, 02 and 03 can be replaced with short names so viewers do not have to remember what each number means.
This product contains one infographic slide with editable placeholder text, icons, colours and shapes. It does not provide research, technical definitions or a complete technology presentation. Customize the PowerPoint file with information from your own system, project or lesson, or adjust the visual through the product page’s Edit option.
For other ways to compare intersecting subjects, explore the Venn Diagram PowerPoint Templates. When your topic requires a complete deck or a different technical structure, browse the parent Technology Presentation Templates collection.


You May Also Like These PowerPoint Templates
Showing20 of69,218 templates