Quarterly Report Template PowerPoint and Google Slides

Colorful quarterly report slide showing bar charts, a pie chart, and task timelines from 2021 to 2024 with three sections.
P.ID : 60428
    5.7K+ views
    458 Downloads
    Get Custom Slides by Experts
    Instantly Access Templates in PowerPoint

    Three Noded Quarterly Report PPT Slide


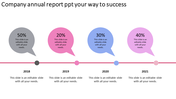
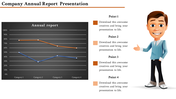
    Present your company's quarterly report more professionally using this high-quality Quarterly Report Template PowerPoint Slide. This template can be used for any business. You can even use it for a video conference, allowing you to present your report. You can easily customize this template and make it unique to your business. Download it right now!

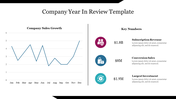
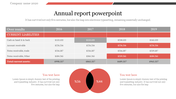
    The Quarterly Report PowerPoint Slide features a white background with multi-color graphs. This creative template will help you to present your report from 2021 to 2024. You can customize the years and values according to your needs. It has a legend on the left side, labeled with timeline, report, and report shortcut. The colors used in this slide are unique and more pleasant.

    Features of this template:

    1. 100% customizable slides and easy to download.
    2. Slides available in different nodes & colors.
    3. The slide contained 16:9 and 4:3 format.
    4. Easy to change the slide colors quickly.
    5. Well-crafted template with instant download facility.
    6. AN excellent slide to present your business report.
    Advertisement

    You May Also Like These PowerPoint Templates

    Free
    Add to Wishlist
    Download
    AI Customize
    Business review PowerPoint slide featuring icons for steps, with captions and a lightbulb icon.
    Add to Wishlist
    Download
    AI Customize
    Weekly planner table with colorful bars indicating tasks for each month from January to June with placeholder text.
    Add to Wishlist
    Download
    AI Customize
    Timeline of weekly project report submissions across four months, using color-coded bars to different report durations.
    Add to Wishlist
    Download
    AI Customize
    An infographic slide showing survey results with a pie chart and percentages for 2016, 2017, and 2018, each with icons.
    Add to Wishlist
    Download
    AI Customize
    Report PowerPoint template showing a workspace with a laptop, clipboard, and stationery on a geometric patterned background.
    Free
    Add to Wishlist
    Download
    AI Customize
    Annual sales template with a green pie chart, a cartoon character pointing to it, and space for headings and descriptions.
    Add to Wishlist
    Download
    AI Customize
    Business report PPT with bar and pie charts including sales by location, units per transaction, and customer retention rate.
    Add to Wishlist
    Download
    AI Customize
    Status report table with five phases, colored lines connecting points, and text rows on a gray and white grid background.
    Add to Wishlist
    Download
    AI Customize
    2019 annual report slide design with brown and orange geometric shapes and a building image in the layout.
    Add to Wishlist
    Download
    AI Customize
    Colorful weekly schedule PowerPoint slide with time slots for each day of the week.
    Free
    Add to Wishlist
    Download
    AI Customize
    Annual report slide with a timeline for 2017 to 2019, featuring speech bubbles in gray, pink, and blue, showing percentages.
    Add to Wishlist
    Download
    AI Customize
    Financial report template with slides covering company statements,  analysis, supervisory board reports, and team profiles.
    Add to Wishlist
    Download
    AI Customize
    Company annual report slide with a gray and red graph displaying data with percentage values for investment and profit.
    Free
    Add to Wishlist
    Download
    AI Customize
    Annual report slide displaying a sales bar chart, an rate donut chart, anrevenue line graph, and an growth bar chart.
    Add to Wishlist
    Download
    AI Customize
    Slide with a revenue chart and metrics for daily, weekly, and yearly sales, along with three user graphs.
    Add to Wishlist
    Download
    AI Customize
    Annual report timeline infographic showing five speech bubbles with percentages 40%, 50%, 55%, 60%, 70% from 2015 to 2019.
    Add to Wishlist
    Download
    AI Customize
    Company Annual Report slide featuring sales data, revenue graphs, and gross profit analysis for 20XX.