Neat Speedometer Template For PPT and Google Slides Presentation

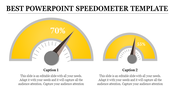
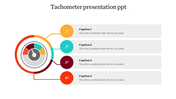
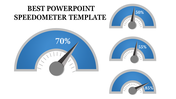
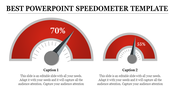
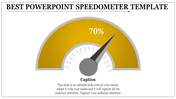
Speedometer PowerPoint Template
Bring out the power of precision in your presentations with our Speedometer PowerPoint Template. Against a sleek and simple background, a speedometer takes center stage. It provides a visual metaphor for progress and velocity. Metric values, displayed in kilometers, add a touch of authenticity to your data.
Ideal for professionals seeking to convey speed, efficiency and progress. The template offers ample space for captions and descriptions. Perfect for business reports, project updates and performance reviews. Download the template now to ensure your audience stays on track and engaged.
Features of the template
- The slide contains 16:9 and 4:3 formats.
- Compatible with Google Slides Themes and PowerPoint.
- 100% customizable slides and easy to download.
- It is easy to change the colors of the slide quickly.
- Well-crafted template with an instant download facility.


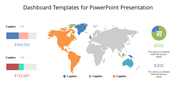
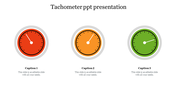
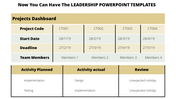
You May Also Like These PowerPoint Templates

Add to Wishlist
Download
Edit

Add to Wishlist
Download
Edit

Add to Wishlist
Download
Edit

Add to Wishlist
Download
Edit


Add to Wishlist
Download
Edit

Add to Wishlist
Download
Edit

Add to Wishlist
Download
Edit

Add to Wishlist
Download
Edit

Add to Wishlist
Download
Edit

Add to Wishlist
Download
Edit


Add to Wishlist
Download
Edit

Add to Wishlist
Download
Edit

Add to Wishlist
Download
Edit

Add to Wishlist
Download
Edit

Add to Wishlist
Download
Edit

Add to Wishlist
Download
Edit

Add to Wishlist
Download
Edit
