MILESTONE 🌟 5 Million+ creative minds trust SlideEgg! Grab 80% OFF

Stunning Chart PowerPoint Presentation Templates Design

Slide showcasing a colorful chart with monthly data from January to September, accompanied by five caption sections.
P.ID : 14765
    215 views
    5 Downloads
    Get Custom Slides by Experts
    Instantly Access Templates in PowerPoint

    Chart PPT Presentation Template Design


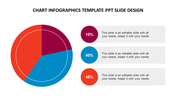
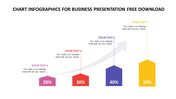
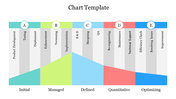
    Create a stunning presentation with our chart PowerPoint template design. This slide can be customized easily to suit your data. An area chart is shown with five different colored sections (red, pink, blue, grey, and red again). "Each section represents a distinct category or data point.". The X-axis of the chart represents the months from January (JAN) to September (SEPT). Above each section of the chart, there are caption placeholders labeled “Caption 1” through “Caption 5.”Additional caption placeholders labeled “Caption 2” and “Caption 4” are also provided.

    Who can use this template?

    This template is perfect for anyone who needs to create presentations that include data visualization, including:

    1. Business professionals (presenting financial results, sales data, or marketing metrics)
    2. Educators (creating charts and graphs for lectures or reports)
    3. Students (presenting research findings or data analysis projects)
    4. Scientists and researchers (communicating complex data sets)


    Benefits of using this template

    Save time and effort: No need to spend hours creating charts from scratch.
    Create professional-looking charts: The template includes a variety of pre-designed charts that are formatted for impact.

    Download the chart PowerPoint template today and let your data do the talking!

    Features of the template:

    •  Slides are available in 4:3 & 16:9
    • Get slides that are 100% customizable and easy to download
    • Highly compatible with PowerPoint and Google Slides.
    Advertisement

    You May Also Like These PowerPoint Templates

    Add to Wishlist
    Download
    AI Customize
    Infographic showing four vertical 3D bars in different colors, each representing percentages with placeholder text area.
    Free
    Add to Wishlist
    Download
    AI Customize
    Data visualization slide showcasing an orange and black bubble chart with labeled axes and a text block on the side.
    Free
    Add to Wishlist
    Download
    AI Customize
    Wave shaped chart on a dark blue background with a detailed caption and numerical labels across the curve.
    Add to Wishlist
    Download
    AI Customize
    Horizontal bar chart with four colored bars in red, blue, purple, and pink, each labeled with a numerical value.
    Add to Wishlist
    Download
    AI Customize
    Circle chart PPT template displaying percentages in four sections with vibrant colors on a white backdrop with captions.
    Add to Wishlist
    Download
    AI Customize
    Colorful pie chart PPT template with four segments showing percentages and corresponding descriptions on the right.
    Add to Wishlist
    Download
    AI Customize
    Business PowerPoint slide displaying colorful pie charts with percent values, with text fields on a white backdrop.
    Free
    Add to Wishlist
    Download
    AI Customize
    Color coded bar chart layout with sections in red, green, purple, and blue, each with labels and a central icon.
    Add to Wishlist
    Download
    AI Customize
    Business template bar graph with stacked segments for three captions, showing percentages per month from January to December.
    Add to Wishlist
    Download
    AI Customize
    Infographic with a four level bar chart in red, green, orange, and pink, paired with percentage labels and text boxes.
    Add to Wishlist
    Download
    AI Customize
    Colorful bar chart PowerPoint slide showing percentage based growth from 25 to 100 percent with placeholder text.
    Add to Wishlist
    Download
    AI Customize
    Mekko chart slides in red and yellow gradients, showcasing various data visualizations with bars and stacked charts.
    Add to Wishlist
    Download
    AI Customize
    Chart template with data visualization in teal bars, quote section with large quotation mark, and percentage highlight.
    Add to Wishlist
    Download
    AI Customize
    Slide with five circular pie charts in orange, green, blue, gray, and red, arranged dynamically, displaying a percentage.
    Add to Wishlist
    Download
    AI Customize
    KWL slide deck with various layouts, using purple, orange, and red, illustrating the learning process in a structured format.
    Free
    Add to Wishlist
    Download
    AI Customize
    PPT Chart Infographics Free Download Design Slides
    Add to Wishlist
    Download
    AI Customize
    Colorful bar chart with five vertical bars in ascending order, each labeled with positive values and curved line above.
    Add to Wishlist
    Download
    AI Customize
    Slide with a stacked area chart in shades of pink, green, and yellow, and three matching circular data labels on the right.
    Add to Wishlist
    Download
    AI Customize
    Triangular chart with overlapping colored sections labeled 30% to 100%, each linked to captions areas below.